Introduction
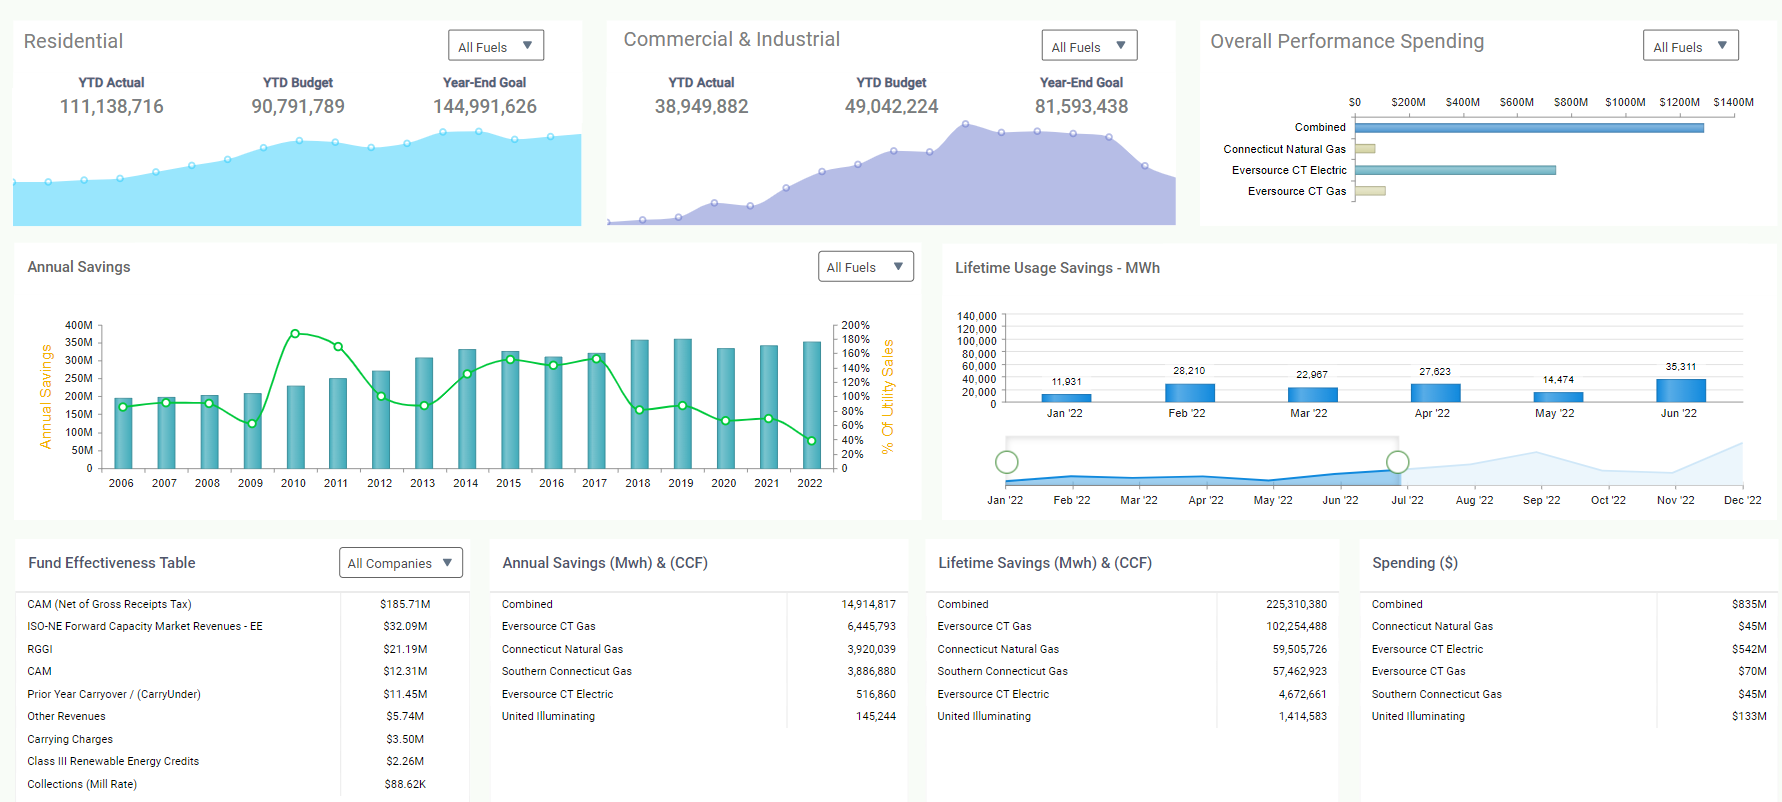
The dashboard is a data visualization tool that displays on a single screen the status of business analytics metrics, key performance indicators (KPIs) and important data points for an organization, department, team or process. (Refer to the image below).


Dashboard contains 4 options –
- Download
- Preferences
- Refresh
- Tab Type
Download
You can download the dashboard with the aid of the “Download option”.
Step 1: Click on the three dots available at the top right corner of the dashboard and hover on “Download”. (Refer to the image below).
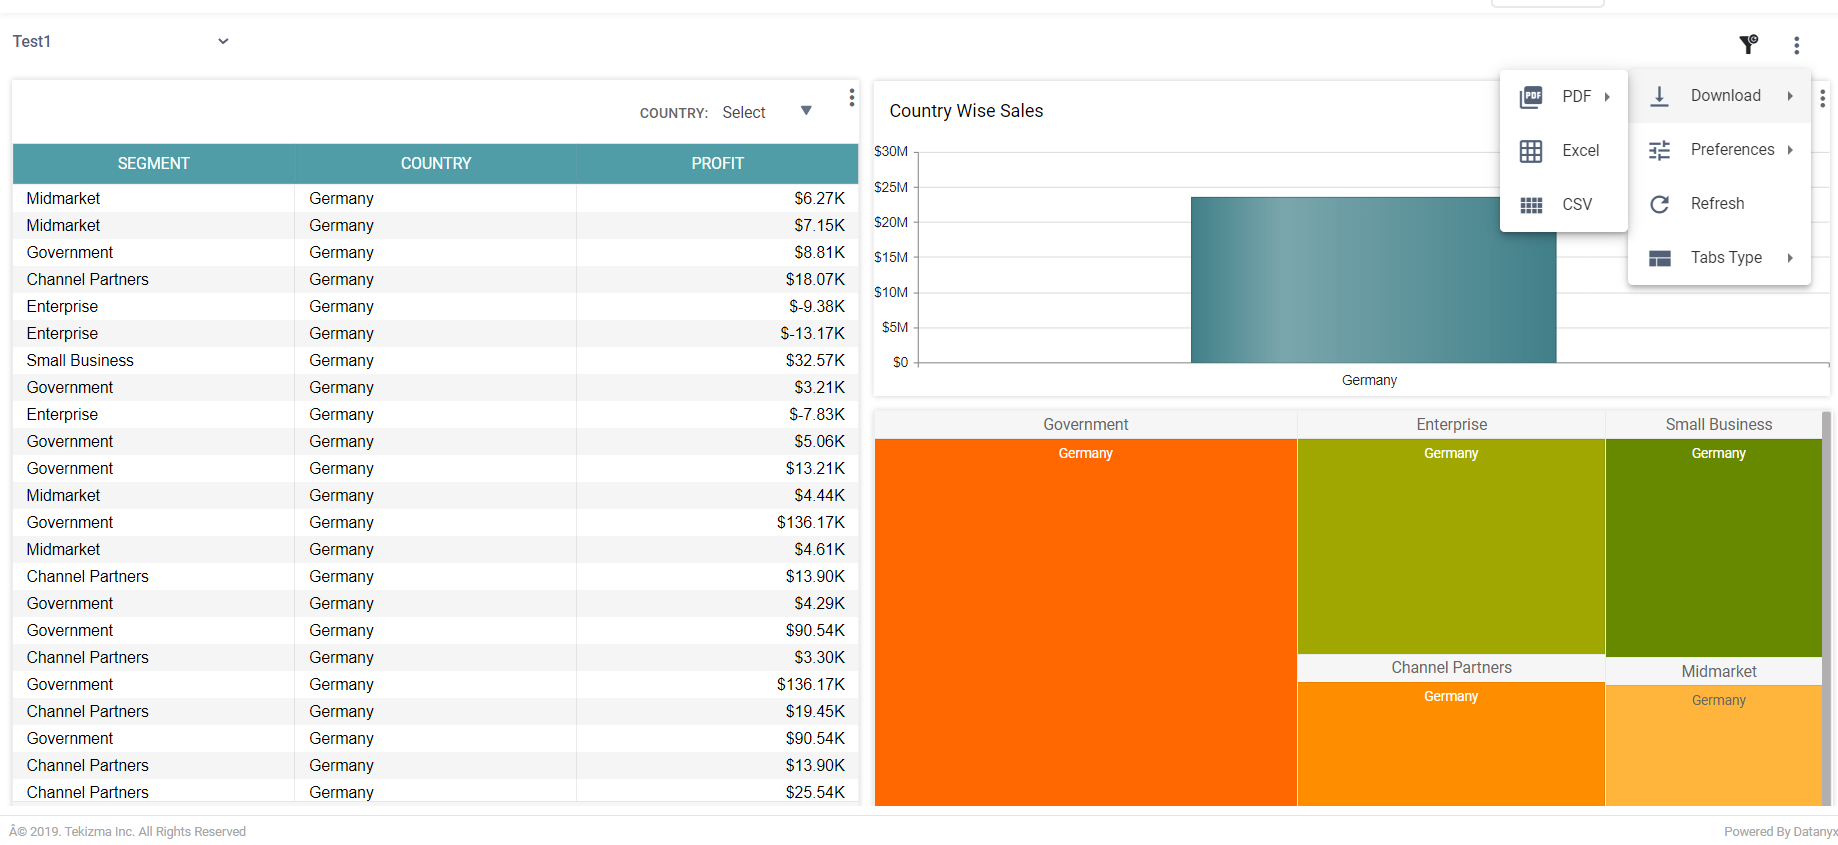
Step 2: You can download the dashboard in different formats, and the same is listed as under:
- Excel
- CSV
You can download the dashboard in PDF format. Now, it will be available in the INBOX, and you are able to download the dashboard in the said format.
Further, you are given two more options under the download as PDF option. They are:
- Current dashboard
- All Dashboard
“Current Dashboard” option will download only the “Currently displayed dashboard” as PDF.
“All Dashboard” option will download all the dashboards available as a PDF. This option will take some time to process the data.
Excel
The Excel option will download all the data in Excel format.
CSV
The CSV option will download the data in CSV format.
Preferences
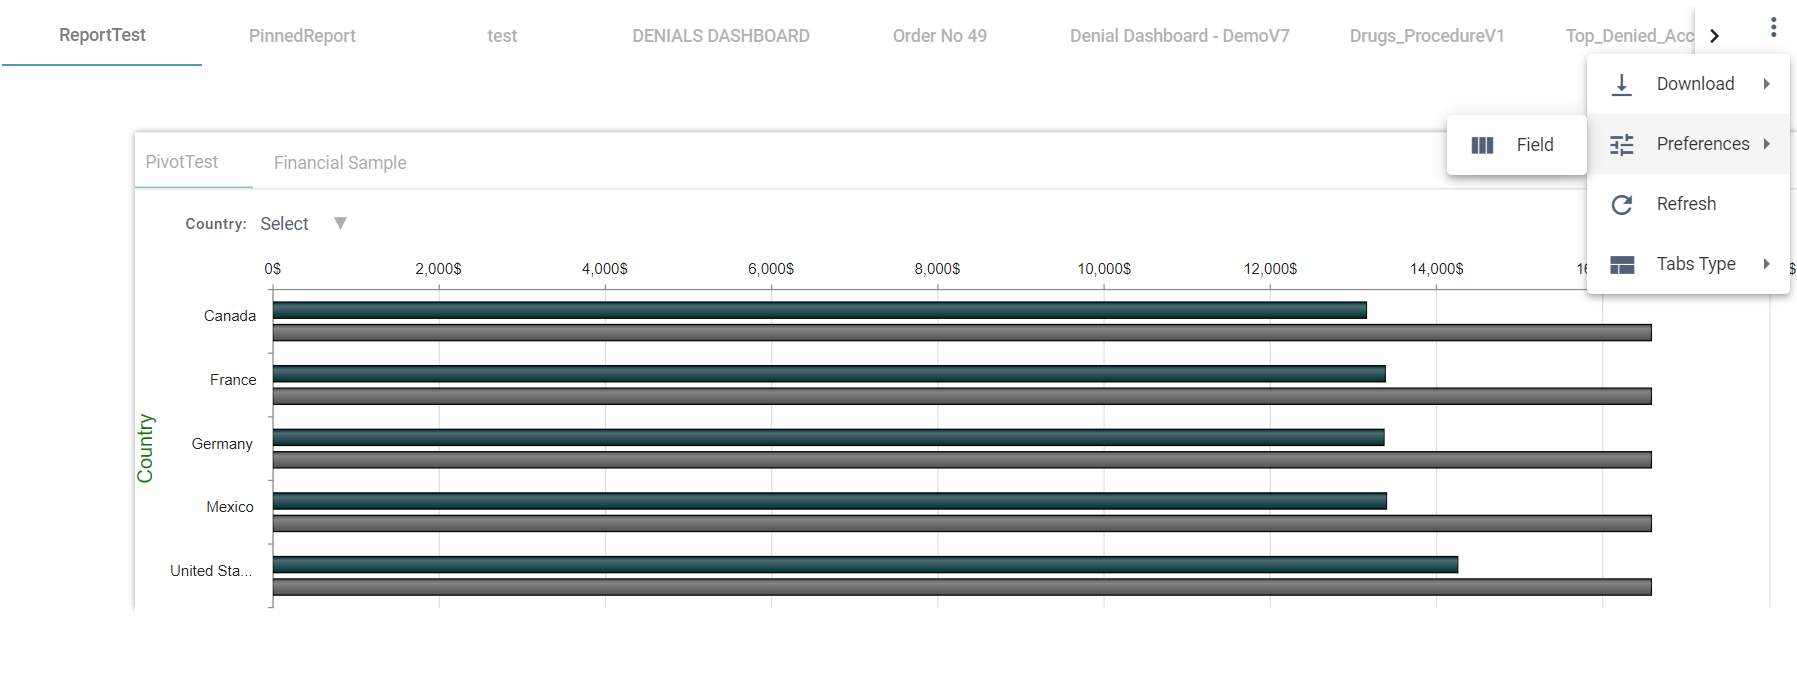
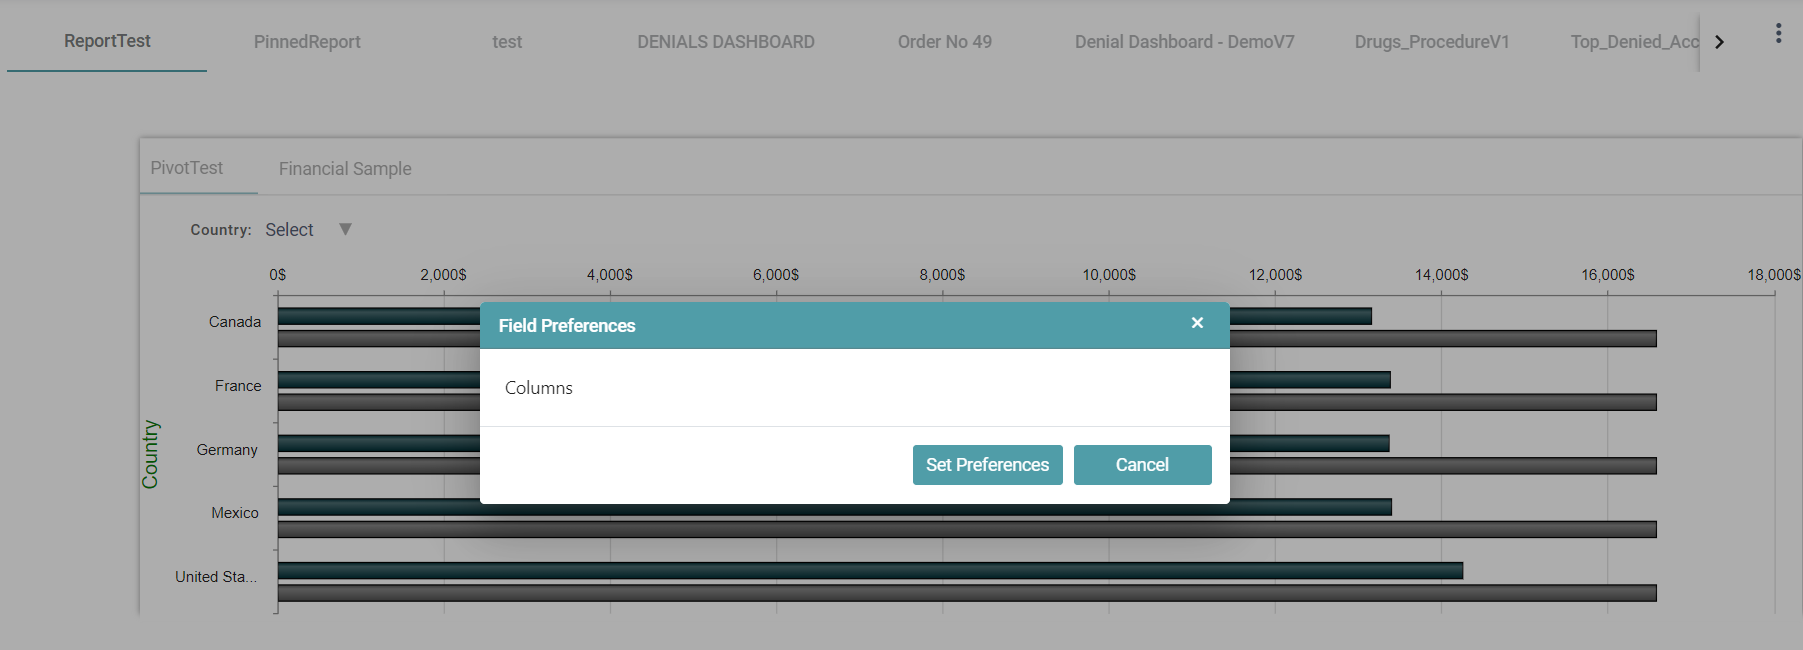
The Preferences option will allow you to select the preferred field for displaying. Click the preferences option, a pop-up will appear and there you can select the preferred field. (Refer to the images below).
Tabs Type
Click on the settings icon on the top right corner of the page. The Tab Type option will display all the dashboard present in 4 different types –
- Tab
- Dropdown
- Button
- Landing Page

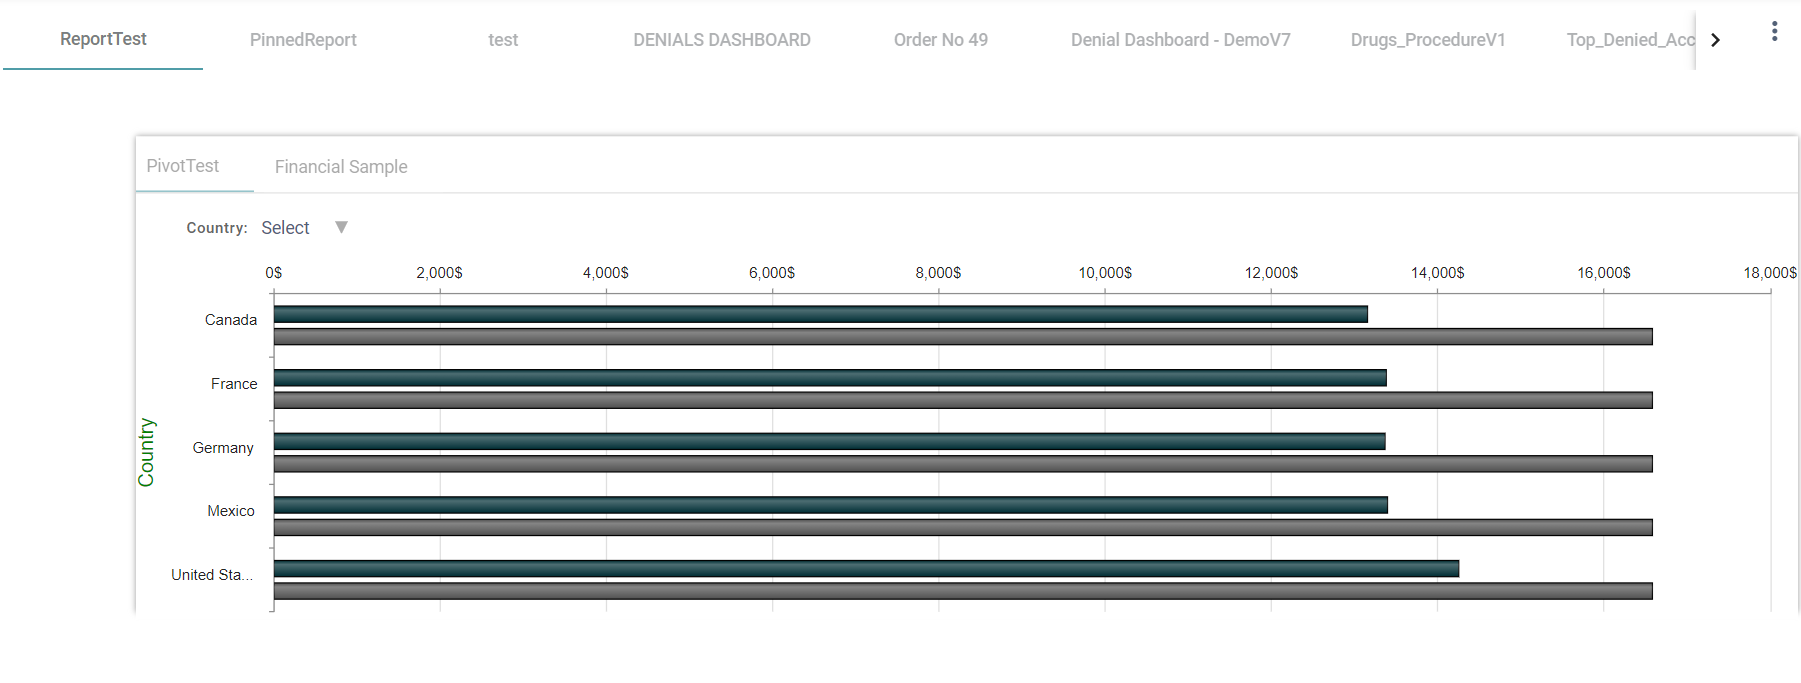
Tab
This option will display all dashboards as tabs. (Refer to the image below).
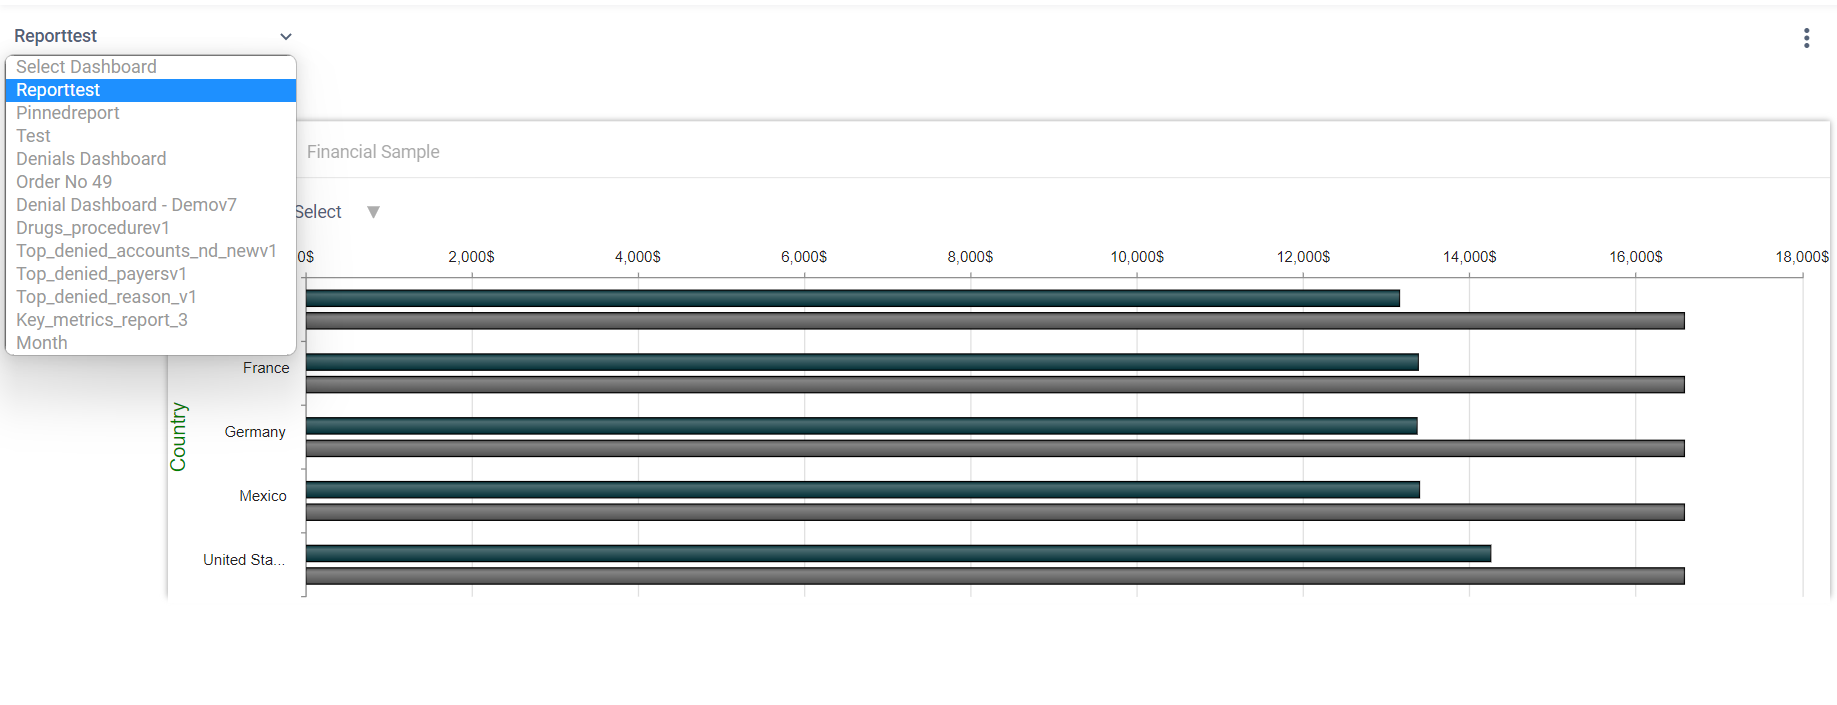
Dropdown
This option will display all the dashboards as a dropdown. (Refer to the image below).
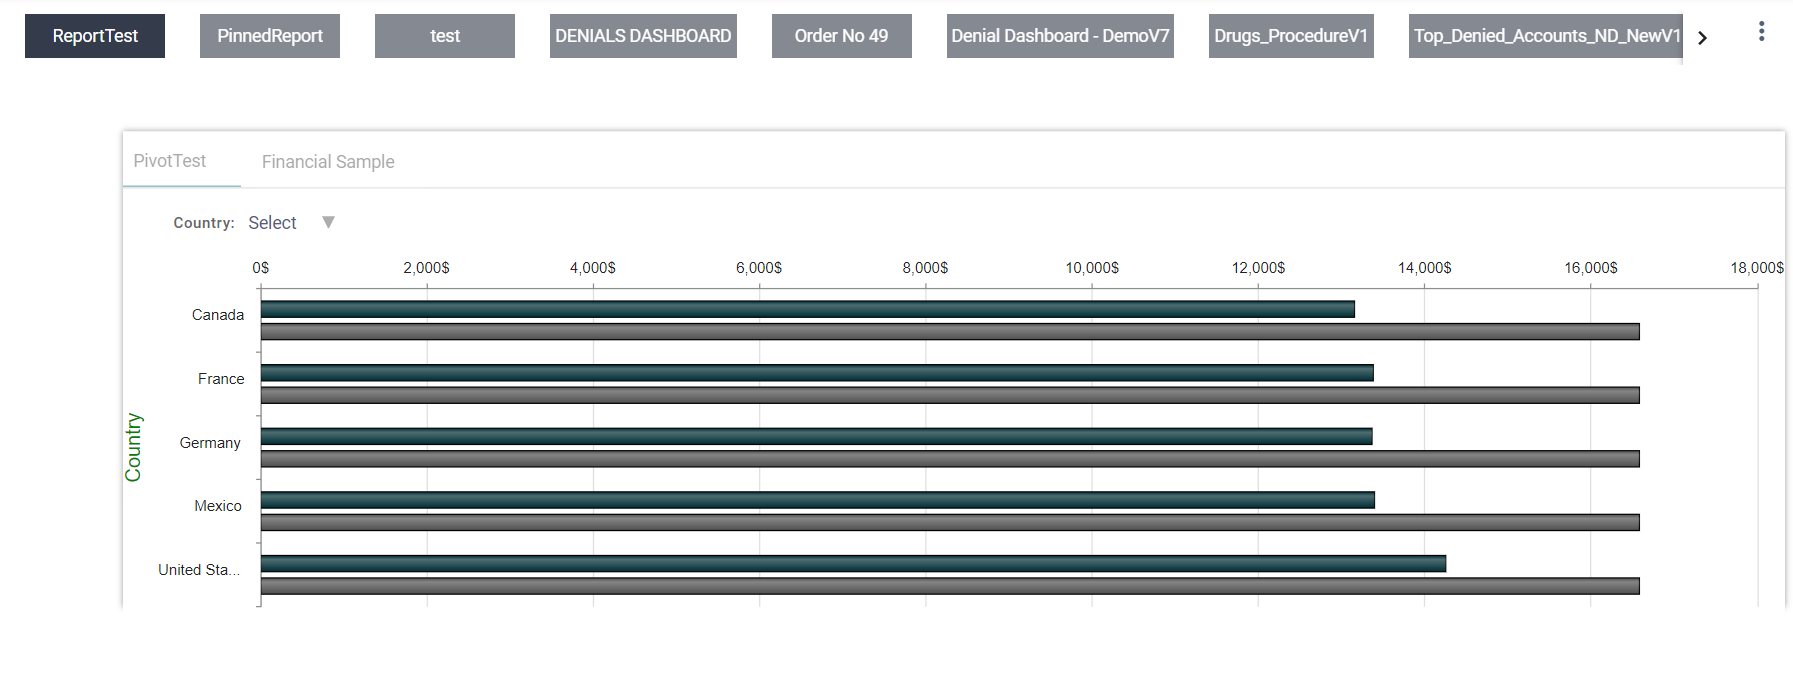
Button
The Button option will display the dashboards as buttons. (Refer to the image below).
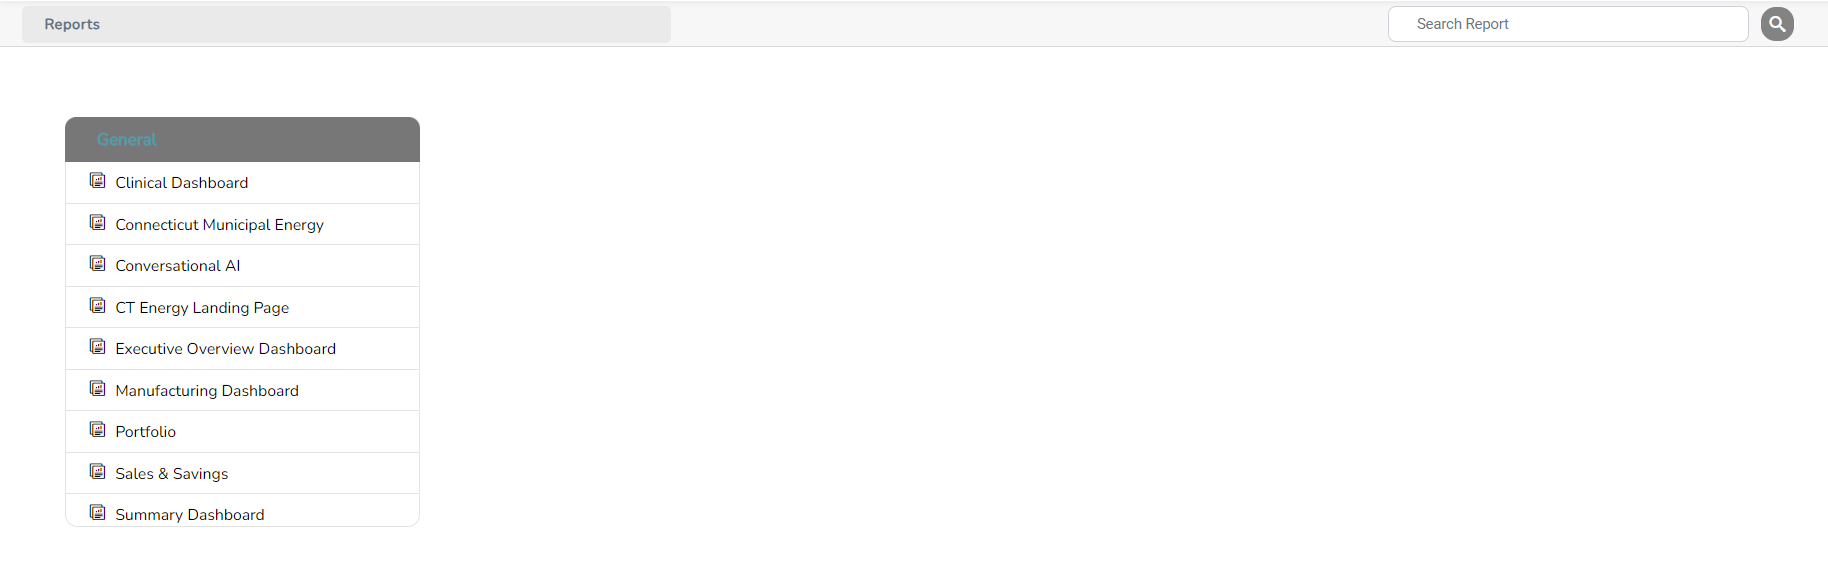
Landing Page
This option will display all the dashboards as a Landing Page. (Refer to the image below).
Dashboard Filter
The Filter option will display the data according to the selected filter. You should apply filters to the report before setting filters on the dashboard.
There are 3 types of filter options –
- Classic
- Pop-up
- Accordion
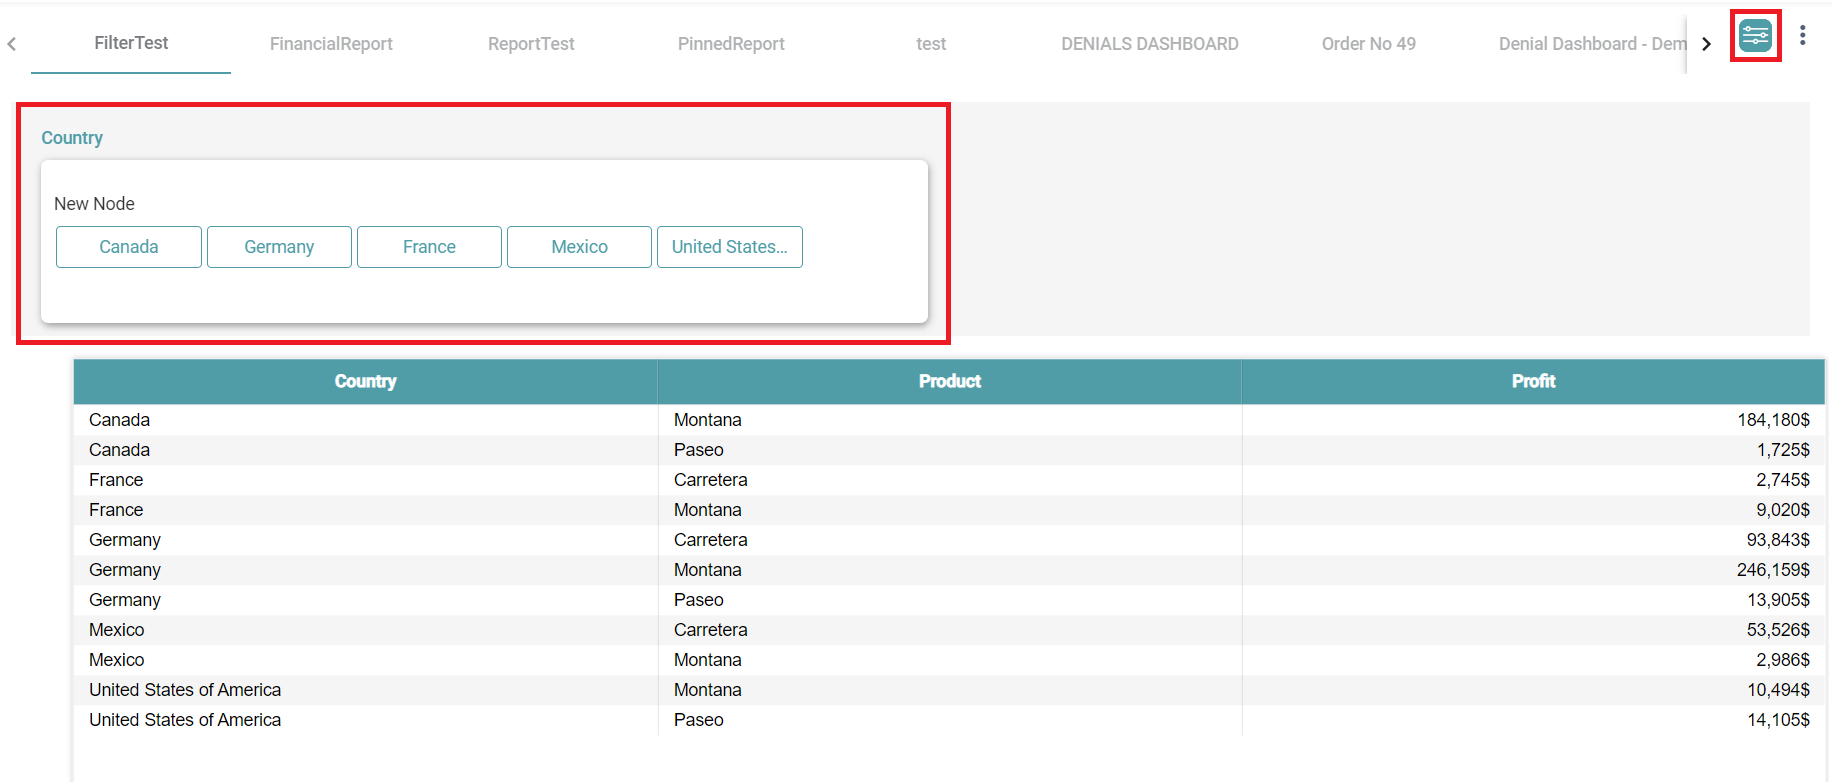
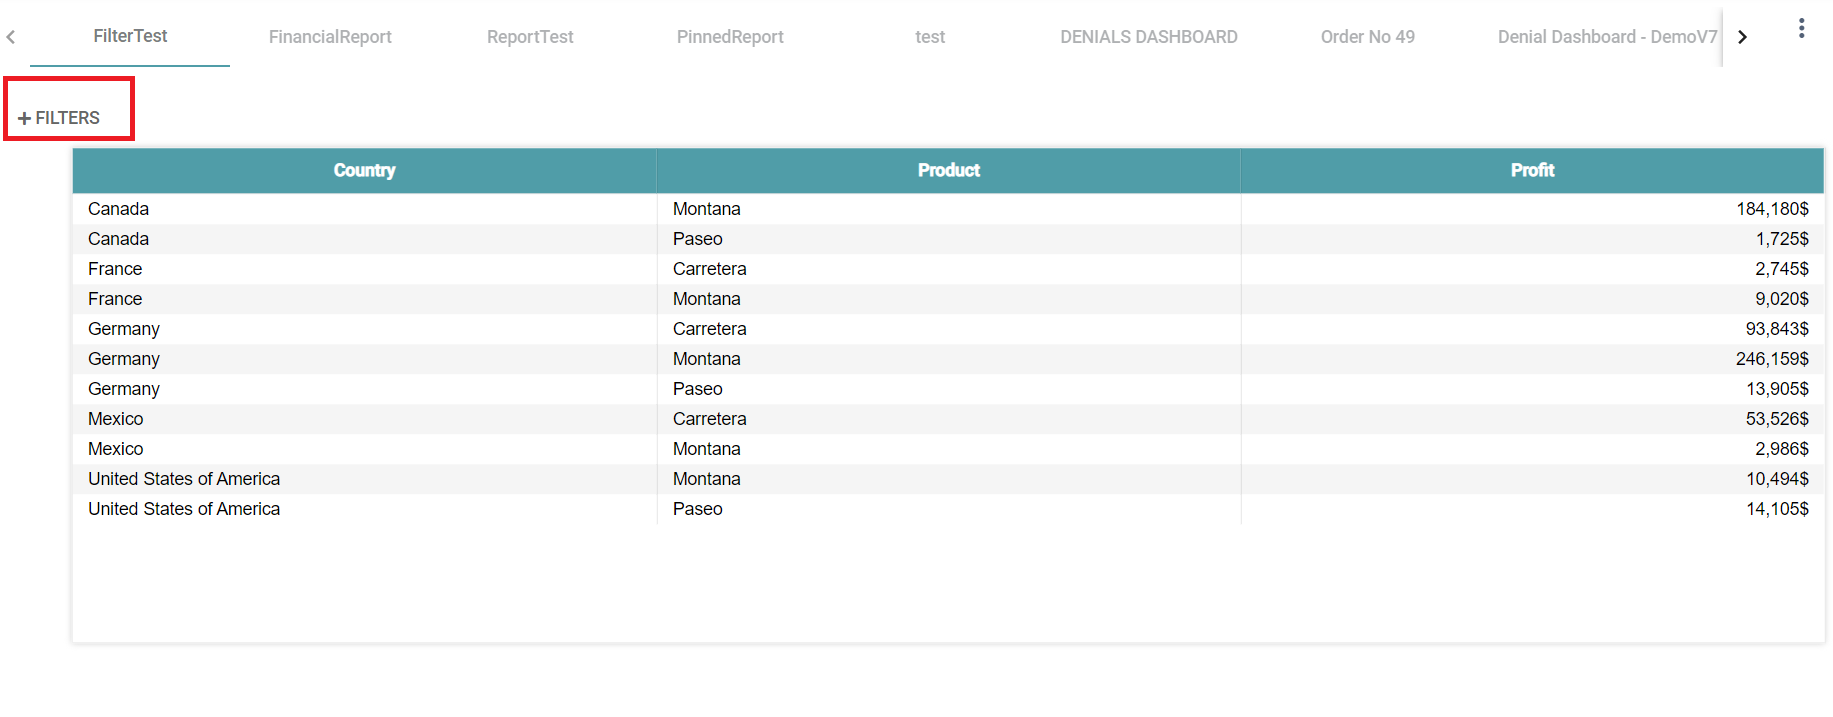
Classic
Step 1: Click on the filter option on the dashboard. The classic filter is now applied. (Refer to the image below).
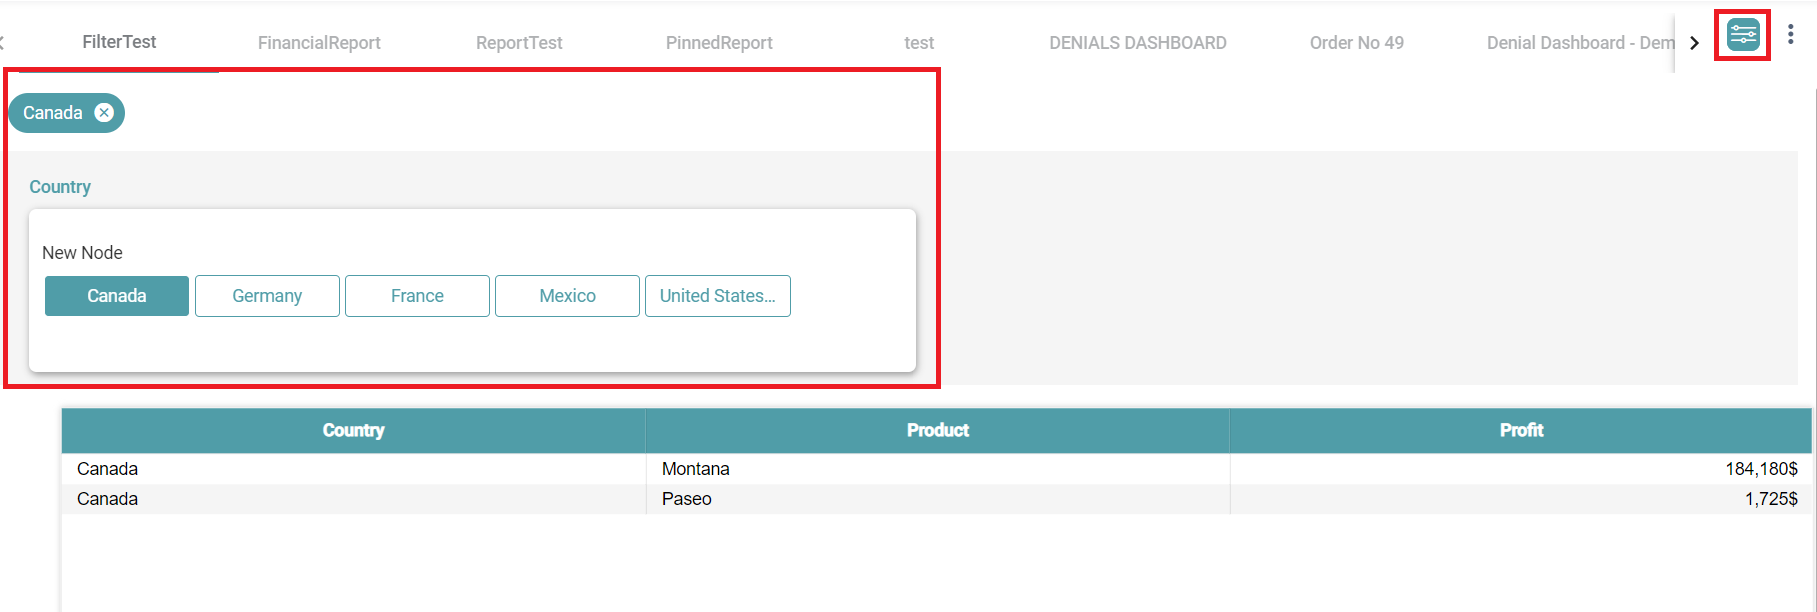
Step 2: Select the values. The data is filtered based on the values selected. (Refer to the image below).
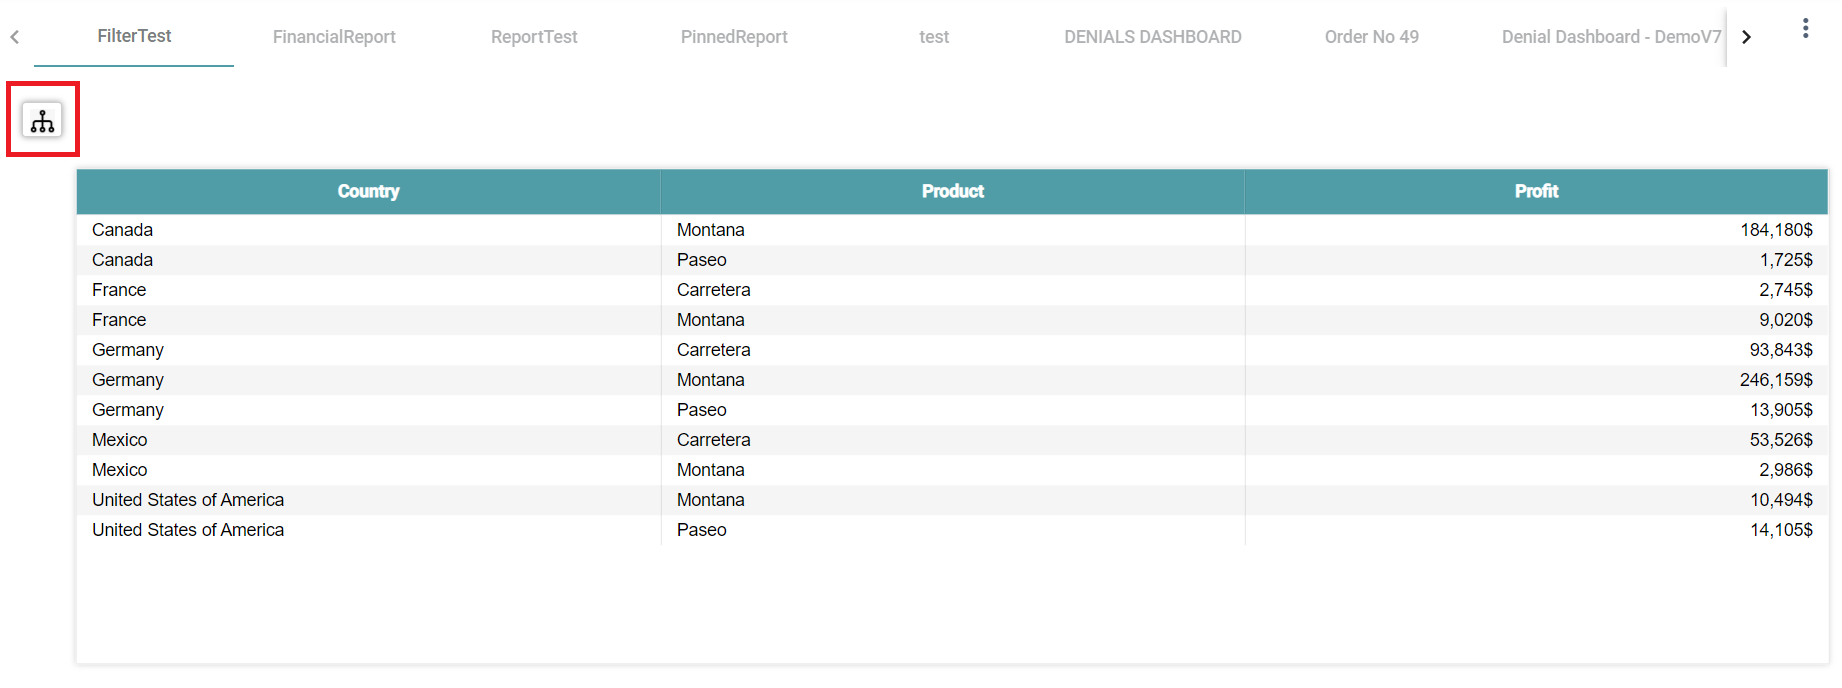
Pop-up
Step 1: Click on the filter option on the dashboard. The pop-up filter is now applied. (Refer to the images below).
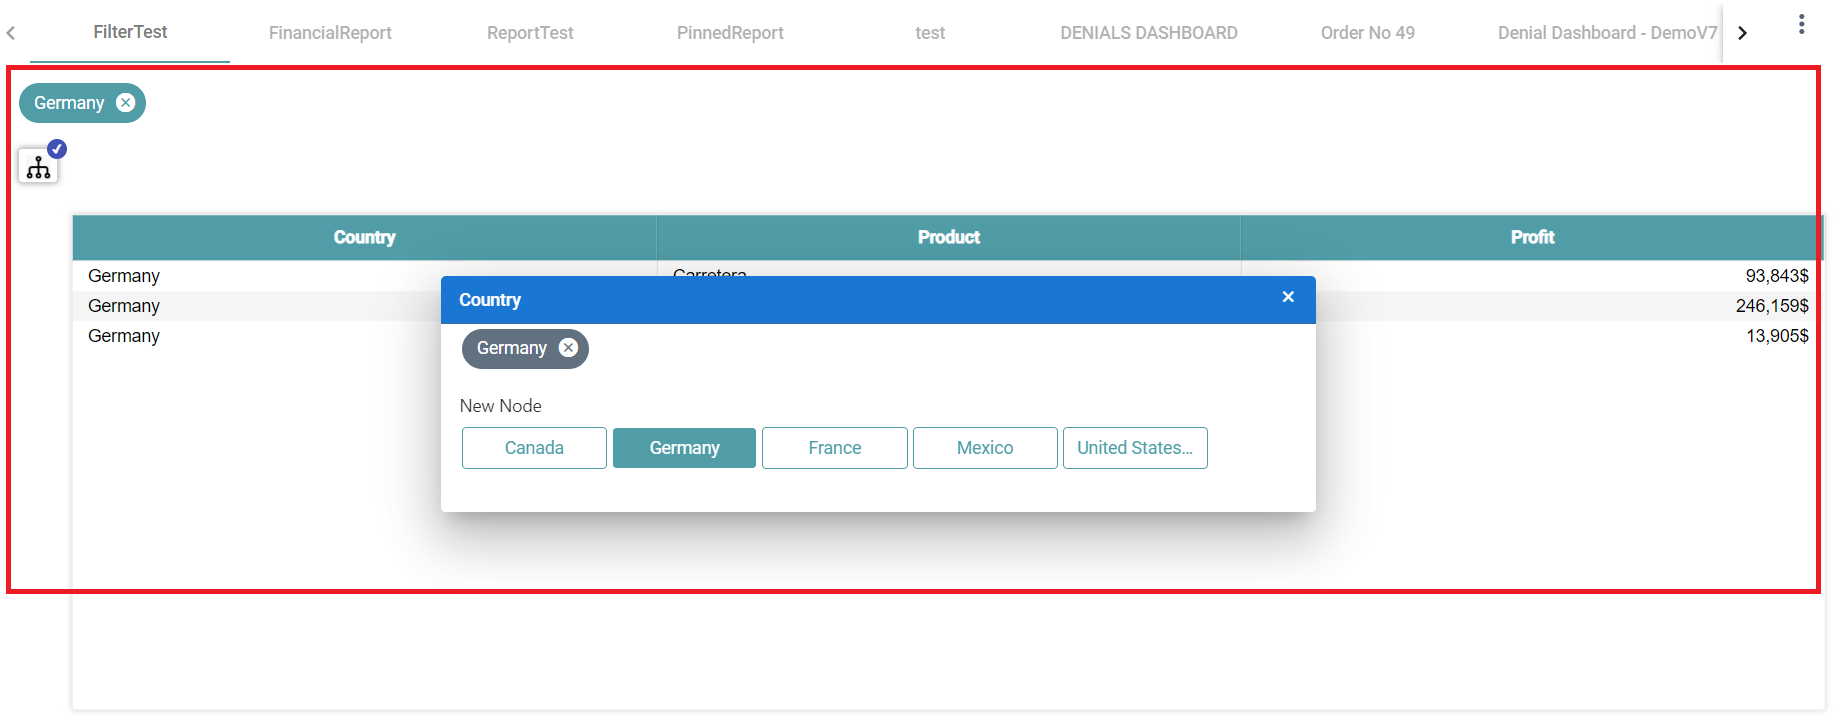
Step 2: Select the values. The data is filtered based on the values selected. (Refer to the images below).
Accordion
Step 1: Click on the filter option on the dashboard. Accordion is now applied. (Refer to the images below).
Step 2: Select the values. The data is filtered based on the values selected. (Refer to the images below).
