Creating a 3D Horizontal Bar Chart
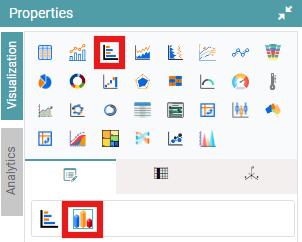
Step 1: On the top right corner of the page, click on visualization under properties. Click on the Horizontal Bar Chart Icon. (Refer to the image below).
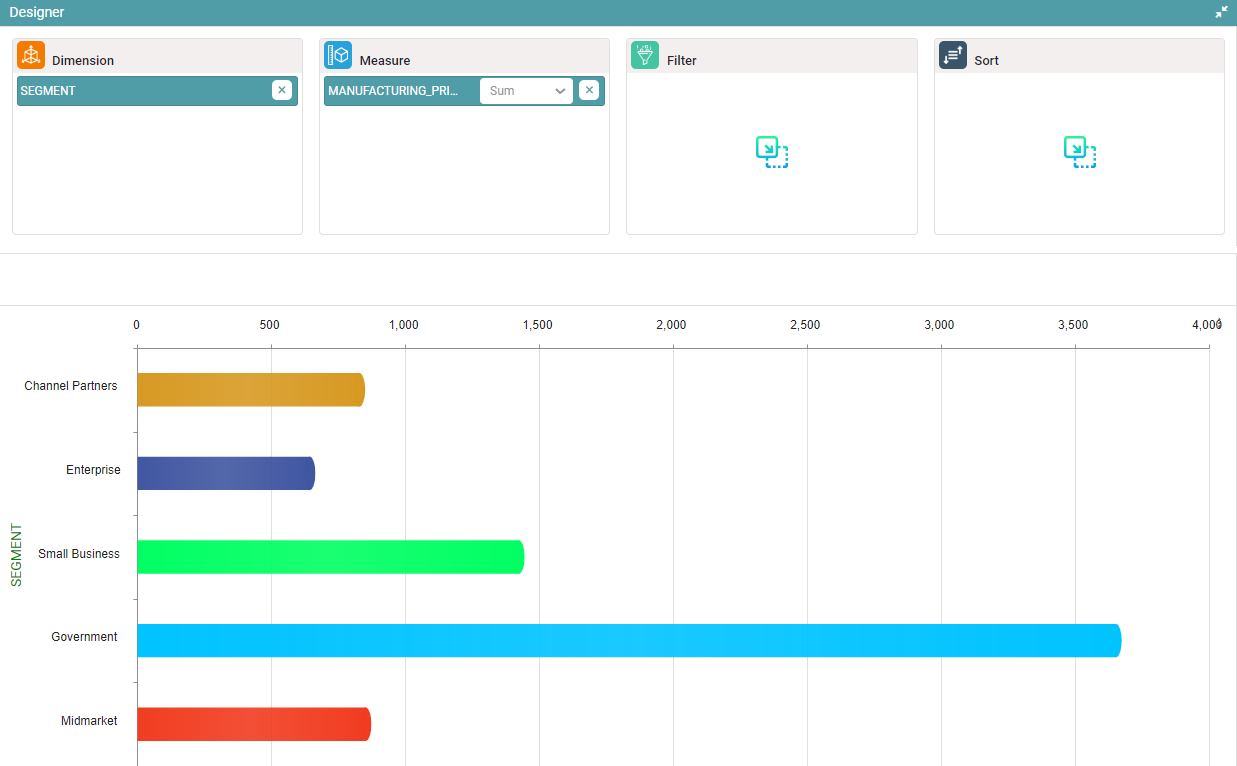
Step 2: Drag and drop columns into dimension and measure.
Step 3: Click on the 3D Horizontal Bar Chart icon. The data is represented as a 3D Horizontal bar chart. (Refer to the image below).


Note: The other functionalities are similar to that of the Bar Chart.