Creating an Area Chart
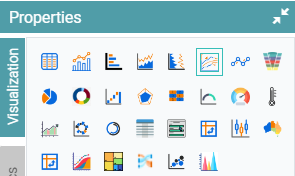
Step 1: On the top right corner of the page, click on visualization under properties. Click on the Area Chart icon under properties. (Refer to the image below).
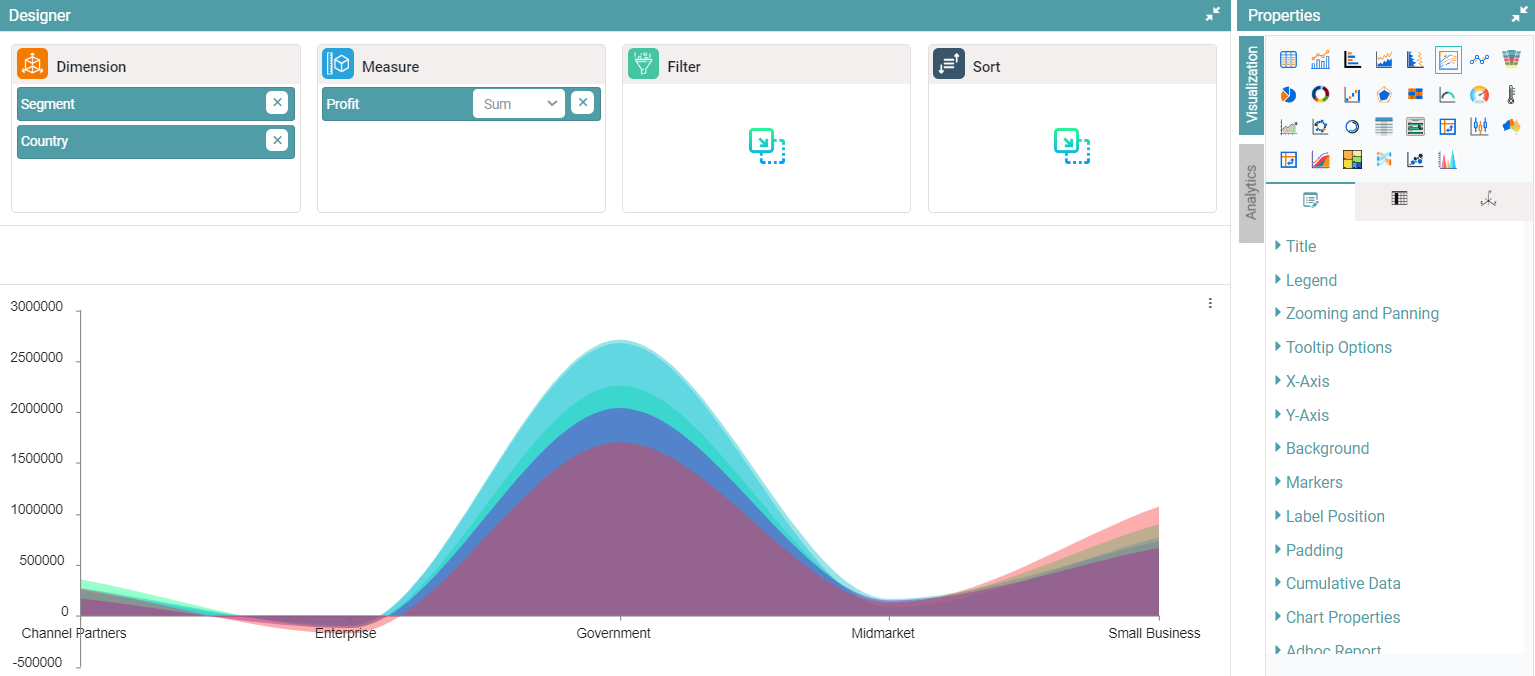
Step 2: Drag and drop the required columns in dimension and measure. The data represented will be in the form of an Area Chart. (Refer to the image below).


Properties
Markers
The Marker property for the Area chart is like that of the Line chart.
Properties are like that of the Bar chart.
Columns
Columns are like that of the Bar chart.