Creating a Box Plot Chart
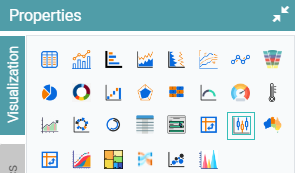
Step 1: On the top right corner of the page, click on visualization under properties. Click on the Box Plot Chart icon under properties. (Refer to the image below).
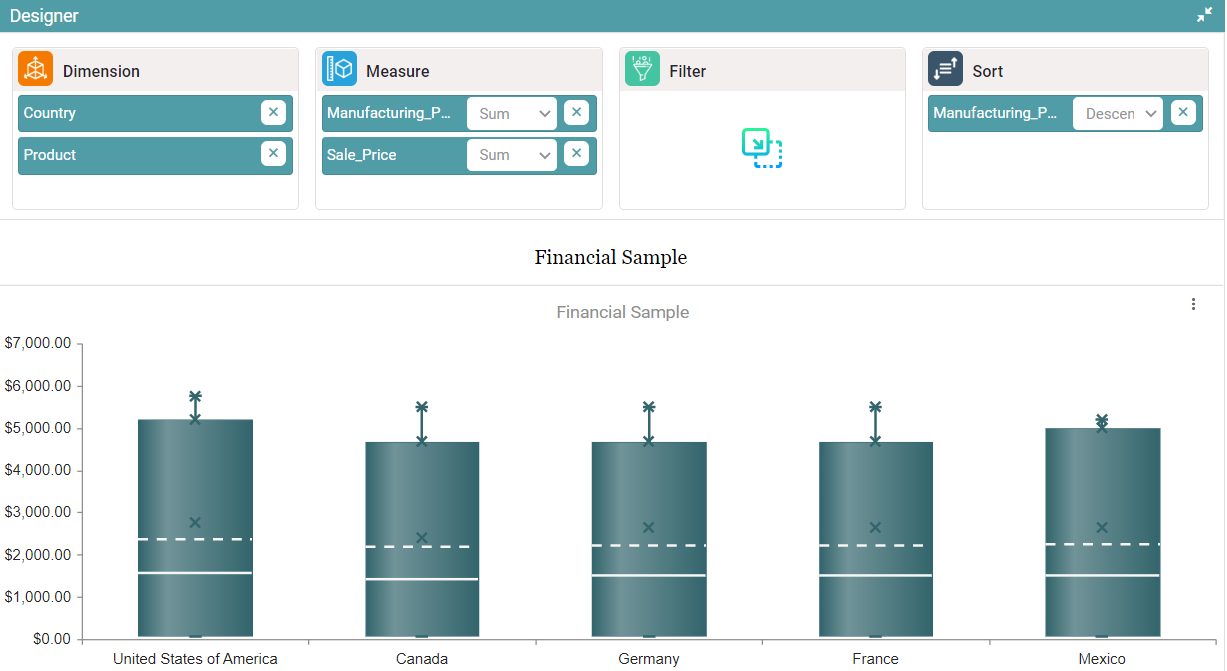
Step 2: Drag and drop the required columns in dimension and measure. The data is represented in the form of a box plot chart. (Refer to the image below).


Properties
Box Plot Chart
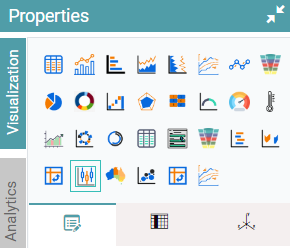
Step 1: On the top right corner of the page, click on visualization under properties. Drag and drop the required columns in dimension and measure. (Refer to the image below).
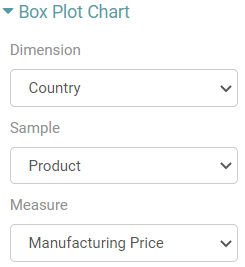
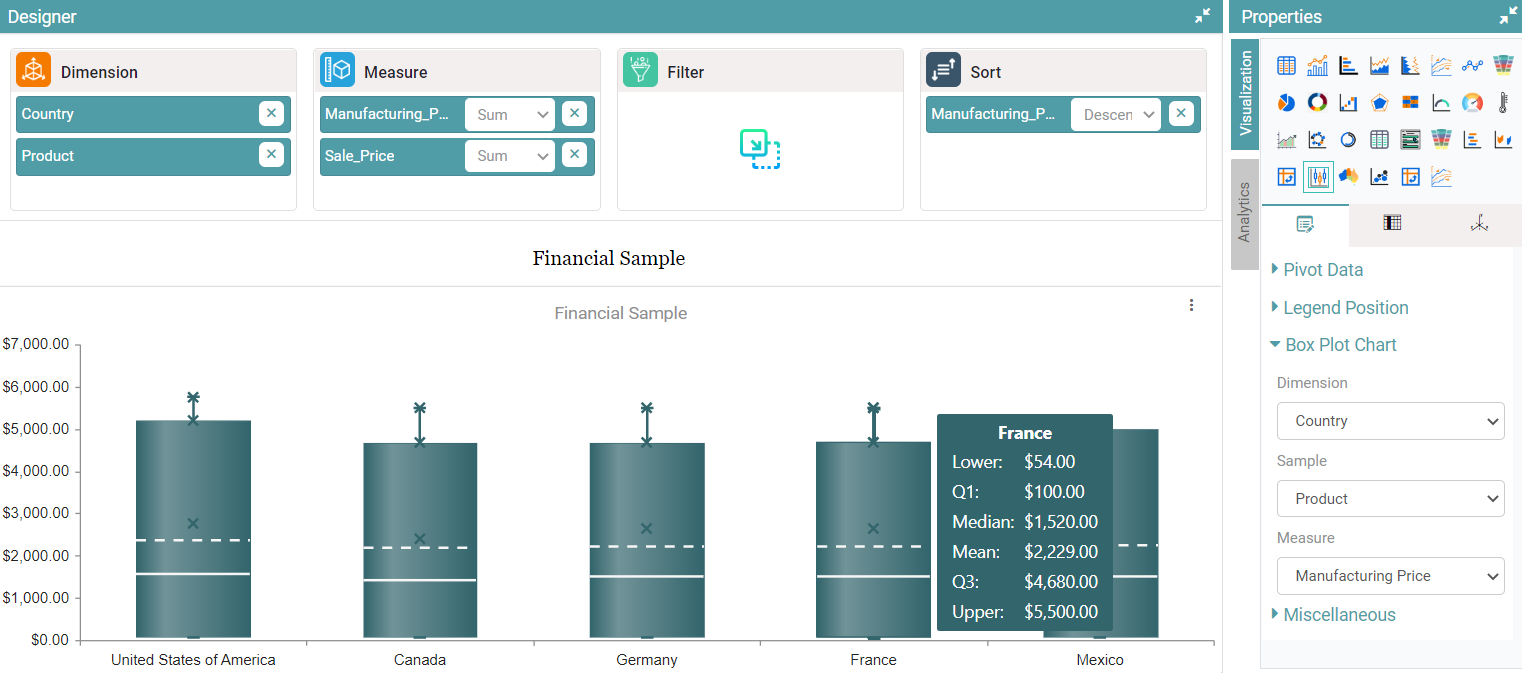
Step 2: Under the box plot chart, the user can select the dimension, sample and measure from the dropdown. (Refer to the image below).
Step 3: The data is represented in accordance with the values chosen. (Refer to the image below).
Other Properties are similar to that of the Table and Bar Chart properties.
Columns
Columns are the same as Table and Bar Chart properties and columns.