Creating a Bubble Chart
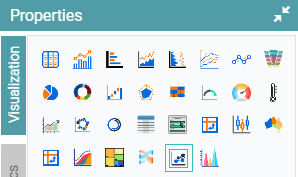
Step 1: On the top right corner of the page, click on visualization under properties. Click on the Bubble icon under properties. (Refer to the image below).
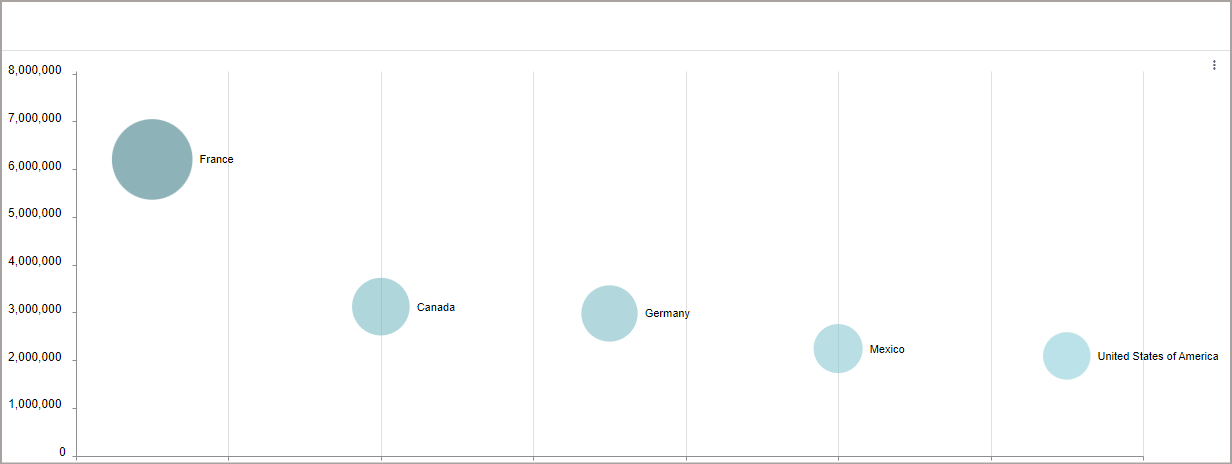
Step 2: Drag and drop the required columns in dimension and measure. The data is represented as a Bubble Chart. (Refer to the image below).


Properties
Bubble Properties
Step 1: On the top right corner of the page, click on visualization under properties. Click on the Bubble icon under properties.
Step 2: Now, navigate to the Bubble Properties option under the properties tab. (Refer to the image below).
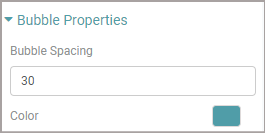
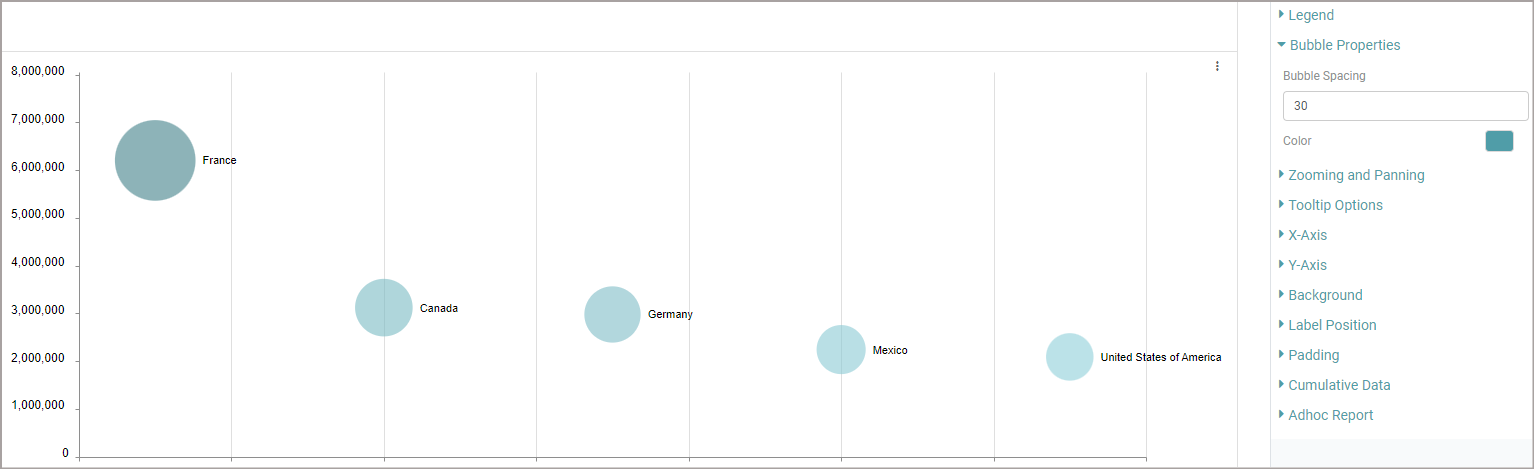
Step 3: Here you can adjust the spacing between the Bubbles and give a desired color to your bubble chart. (Refer to the image below).
Other Properties are similar to that of the Table and Bar chart properties.
Columns
Heat Map
Step 1: On the top right corner of the page, click on visualization under properties. Click on the Bubble icon under properties.
Step 2: Now, navigate to the Heat Map option under the columns tab. (Refer to the image below).
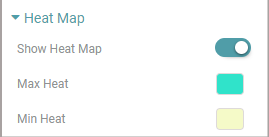
Note: The Heat Map option will be found under the Measure Column Items.
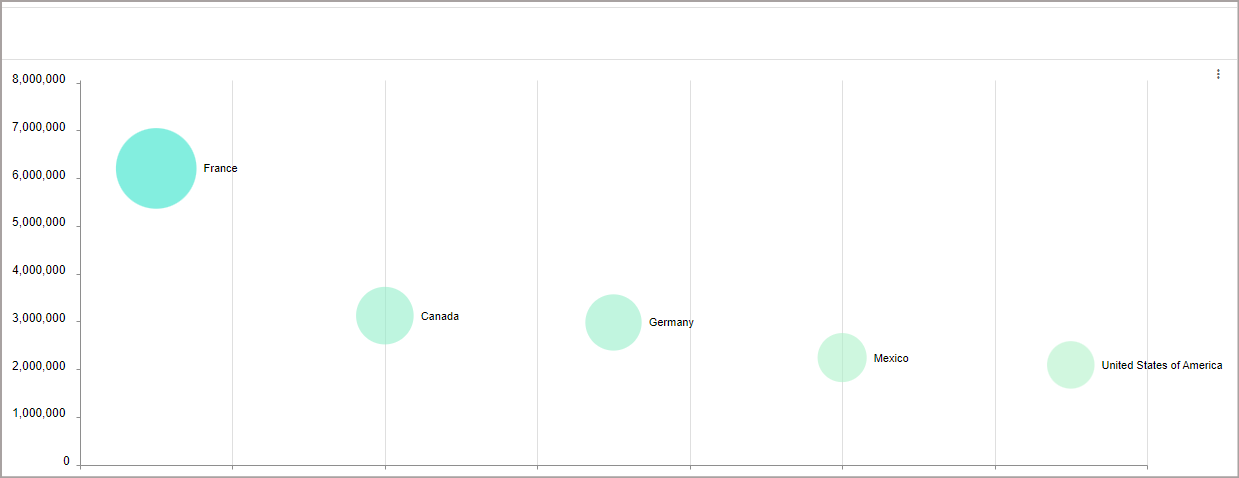
Step 3: You can adjust the heat map to your desired maximum and minimum colors, and the bubble will accurately reflect those colors in terms of value. (Refer to the image below).
Other Columns are the same as Table and Bar chart properties and columns.