Creating a Financial Chart
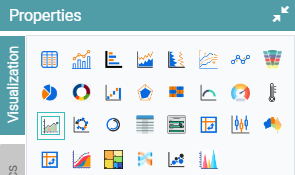
Step 1: On the top right corner of the page, click on visualization under properties. Click on the Financial Chart icon under properties. (Refer to the image below).
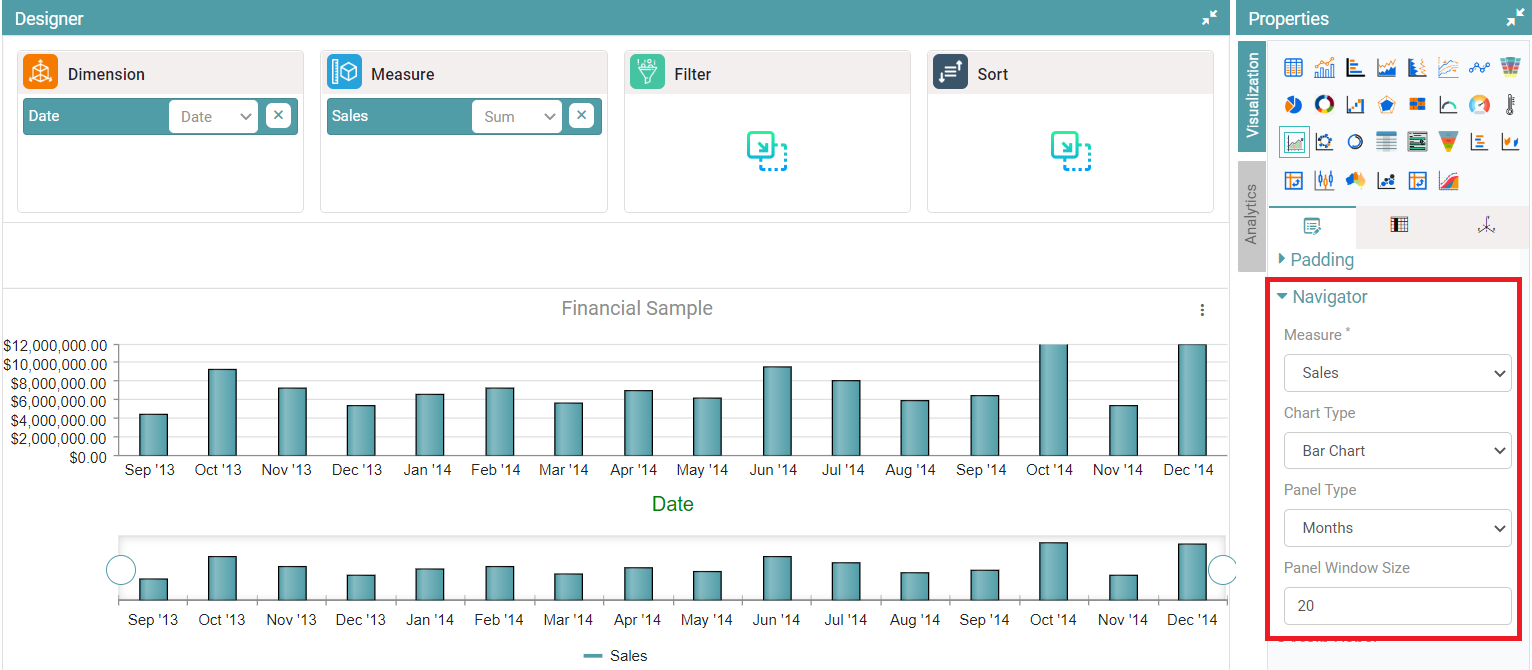
Step 2: Drag and drop the required columns in dimension and measure. The data is represented in the form of a financial chart. (Refer to the image below).


Properties
Navigator
Step 1: On the top right corner of the page, click on visualization under properties. Click on the Financial Chart icon under properties.
Step 2: Drag and drop the required columns in dimension and measure. The data is represented in the form of a financial chart.
Step 3: In navigator, the user can select the measure, chart type, panel type from the dropdown and is able to set the panel window size.
Step 4: The changes are updated in the financial chart. (Refer to the image below).
Main Panel
Step 1: On the top right corner of the page, click on visualization under properties. Click on the Financial Chart icon under properties.
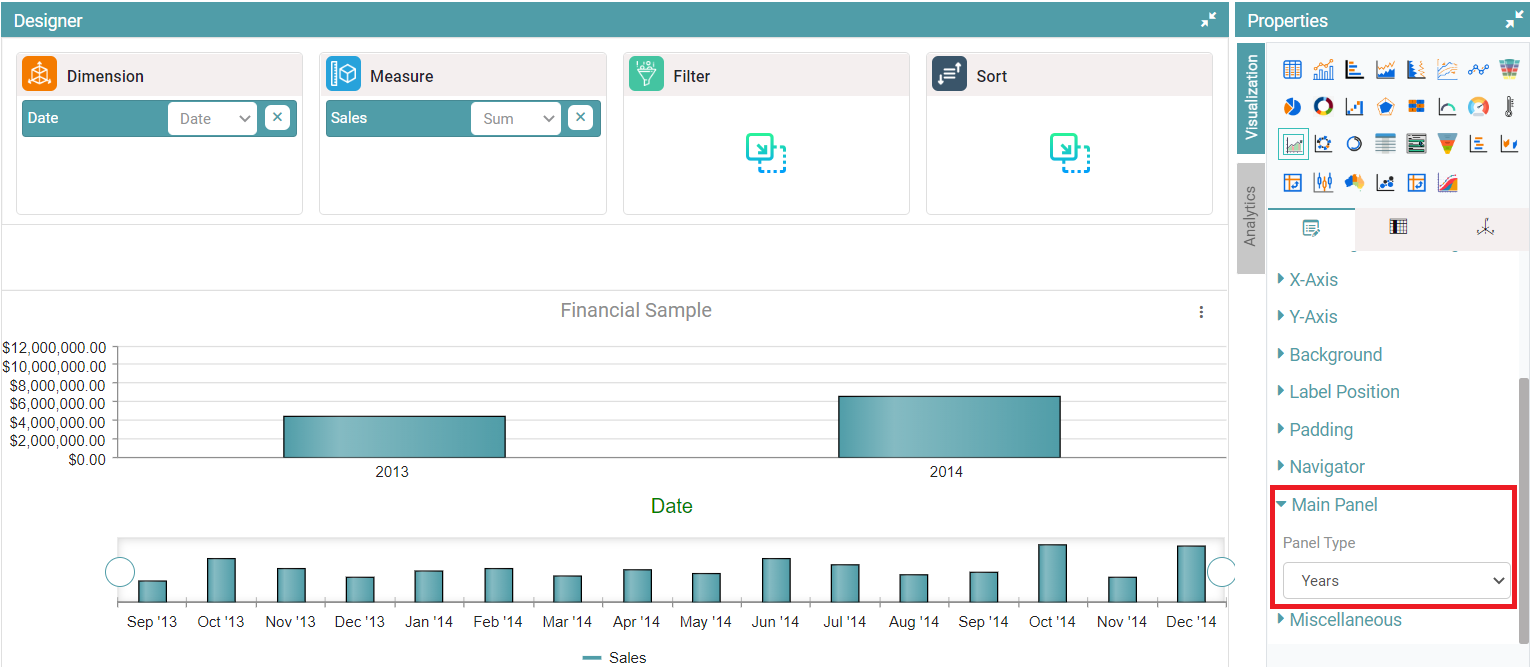
Step 2: Drag and drop the required columns in dimension and measure. The data is represented in the form of a financial chart.
Step 3: You can set the panel type for the main panel from the panel type drop down. (Refer to the image below).
Note: Other Properties are similar to that of the Bar Chart.
Columns
Columns are similar to that of the Bar Chart.