Creating a Geo Chart
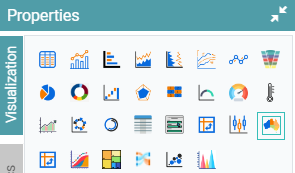
Step 1: On the top right corner of the page, click on visualization under properties. Click on the Geo Chart icon under properties. (Refer to the image below).

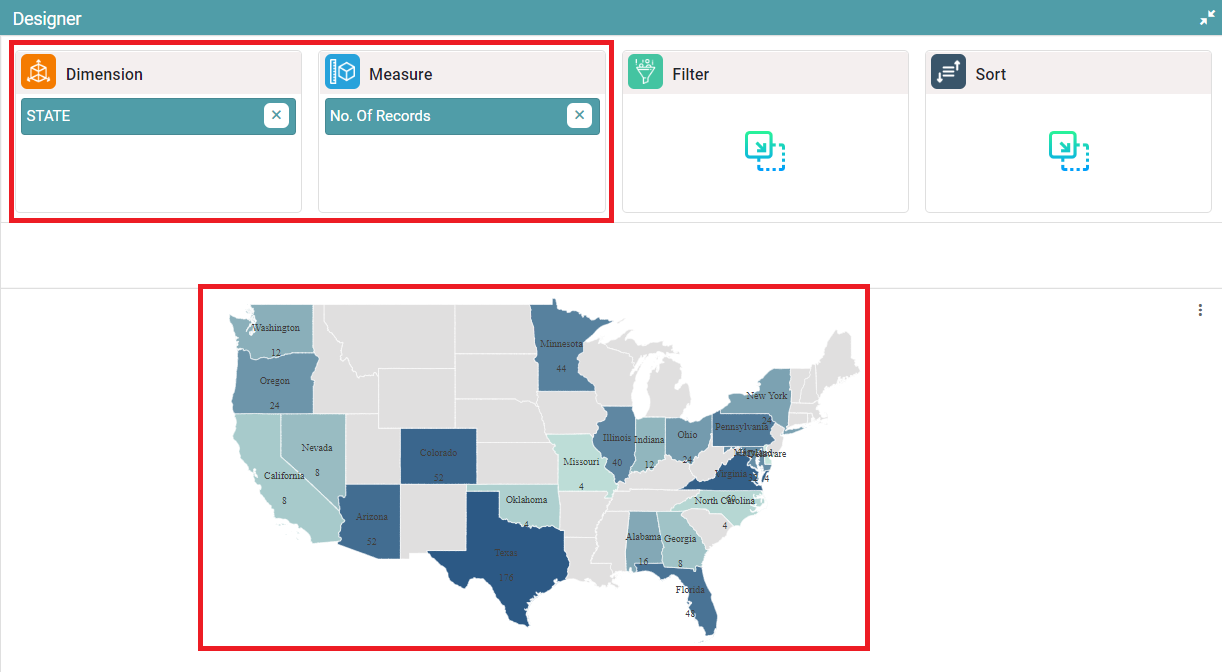
Step 2: Drag and drop the required columns in dimension and measure. The data is represented as a Geo Chart. (Refer to the image below).


Properties
Geo Chart
Step 1: On the top right corner of the page, click on visualization under properties. Click on the Geo Chart icon under properties. (Refer to the image below).
Step 2: Drag and drop the required columns in dimension and measure. The data is represented as a Geo Chart.
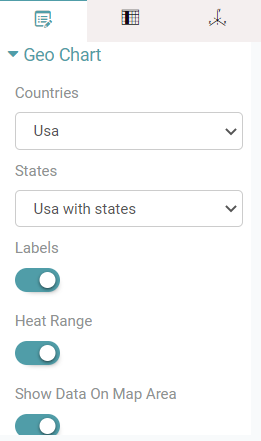
Step 3: Under properties click on geo chart option. The user can choose the Country, State, enable labels, heat range and can choose to show the data on map area. (Refer to the image below).
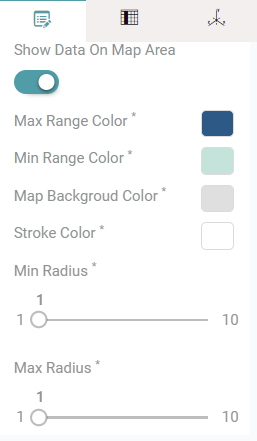
Step 4: Enable the show data on map area toggle and choose the max range color and min range color. You can also change the background color of the map, stroke color, min radius and max radius. (Refer to the images below).
Other properties are similar to that of the Table and Bar chart properties.
Columns
Label
Step 1: On the top right corner of the page, click on visualization under properties. Click on the Geo Chart icon under properties.
Step 2: Drag and drop the required columns in dimension and measure. The data is represented as a Geo Chart.
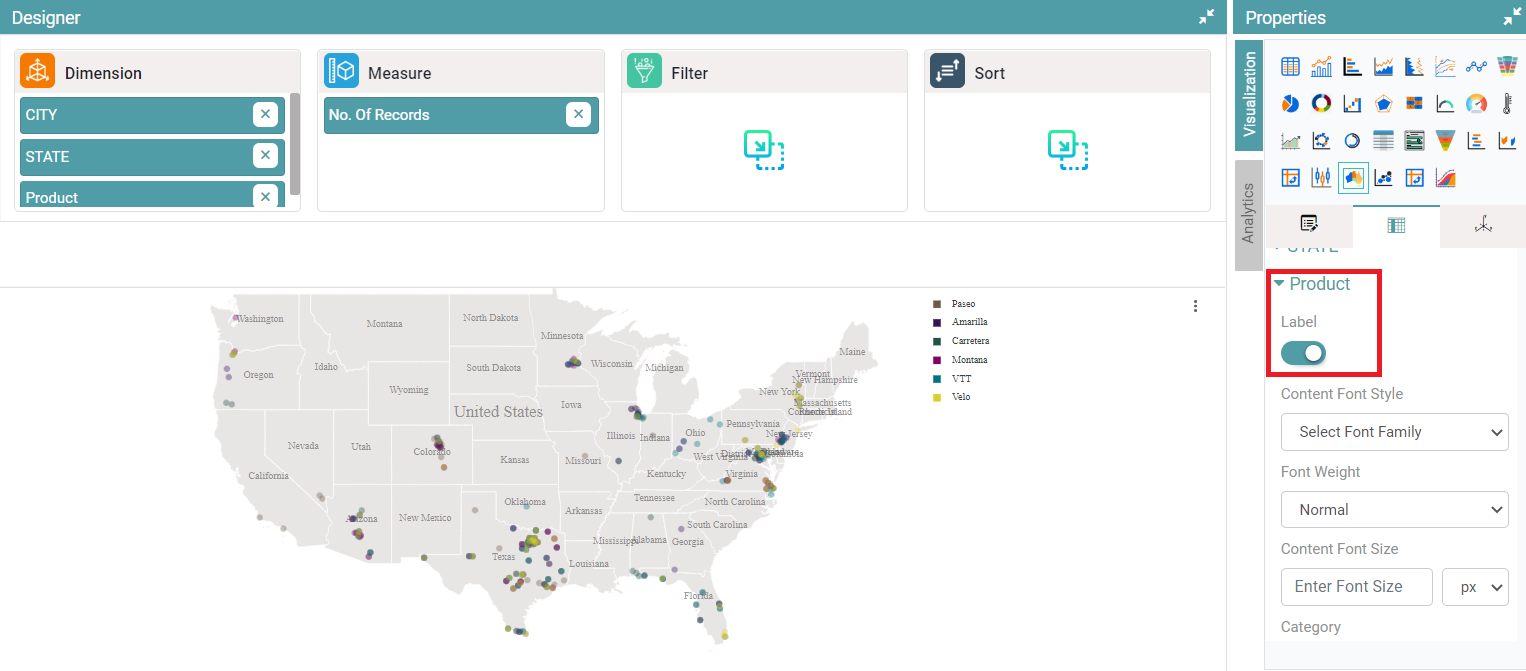
Step 3: Under columns, you can enable the label toggle. Now, the labels enabled are visible on the geo chart. (Refer to the image below).
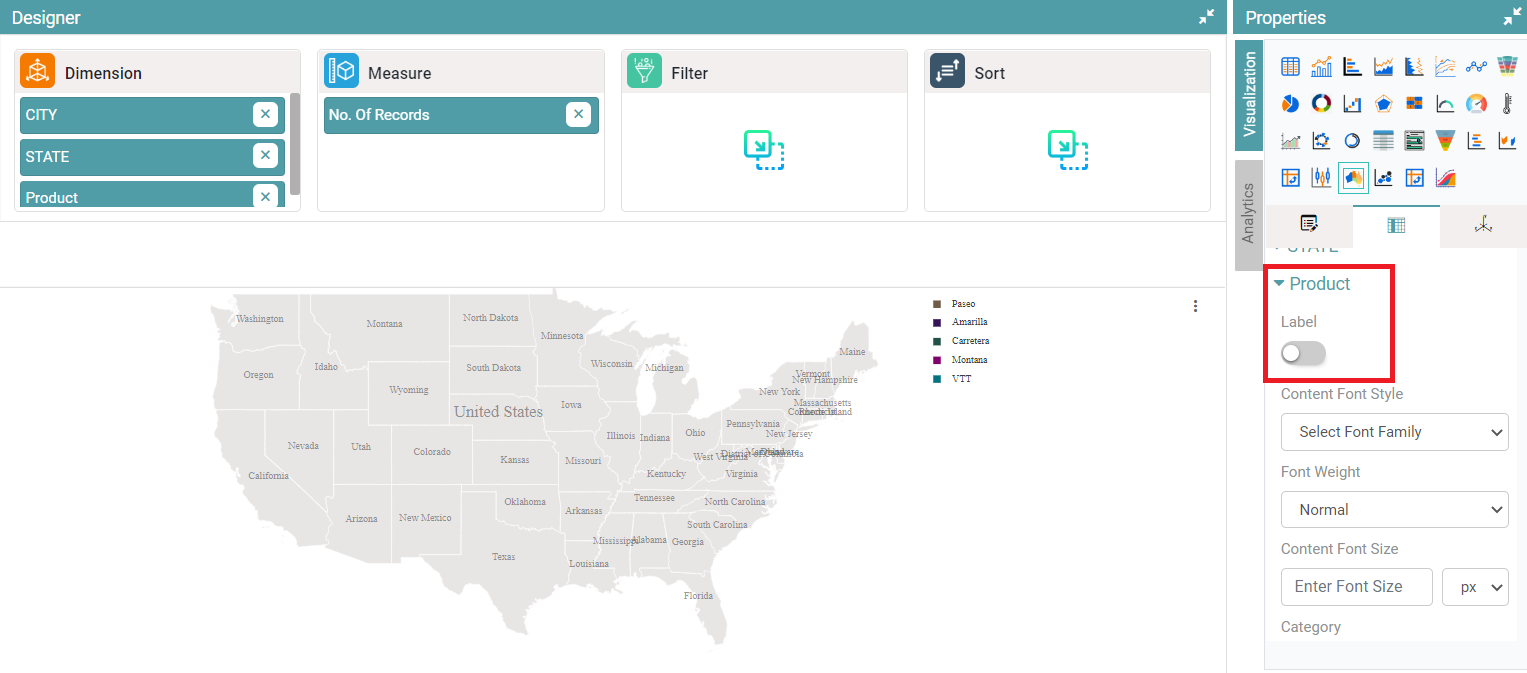
Step 4: Disable the label toggle button and the labels will not be visible on the geo chart. (Refer to the image below).
Other columns are the same as Table and Bar Chart properties and columns.