Creating a Line Chart
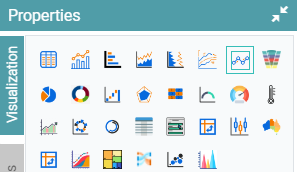
Step 1: On the top right corner of the page, click on visualization under properties. Click on the Line Chart icon under properties. (Refer to the image below).
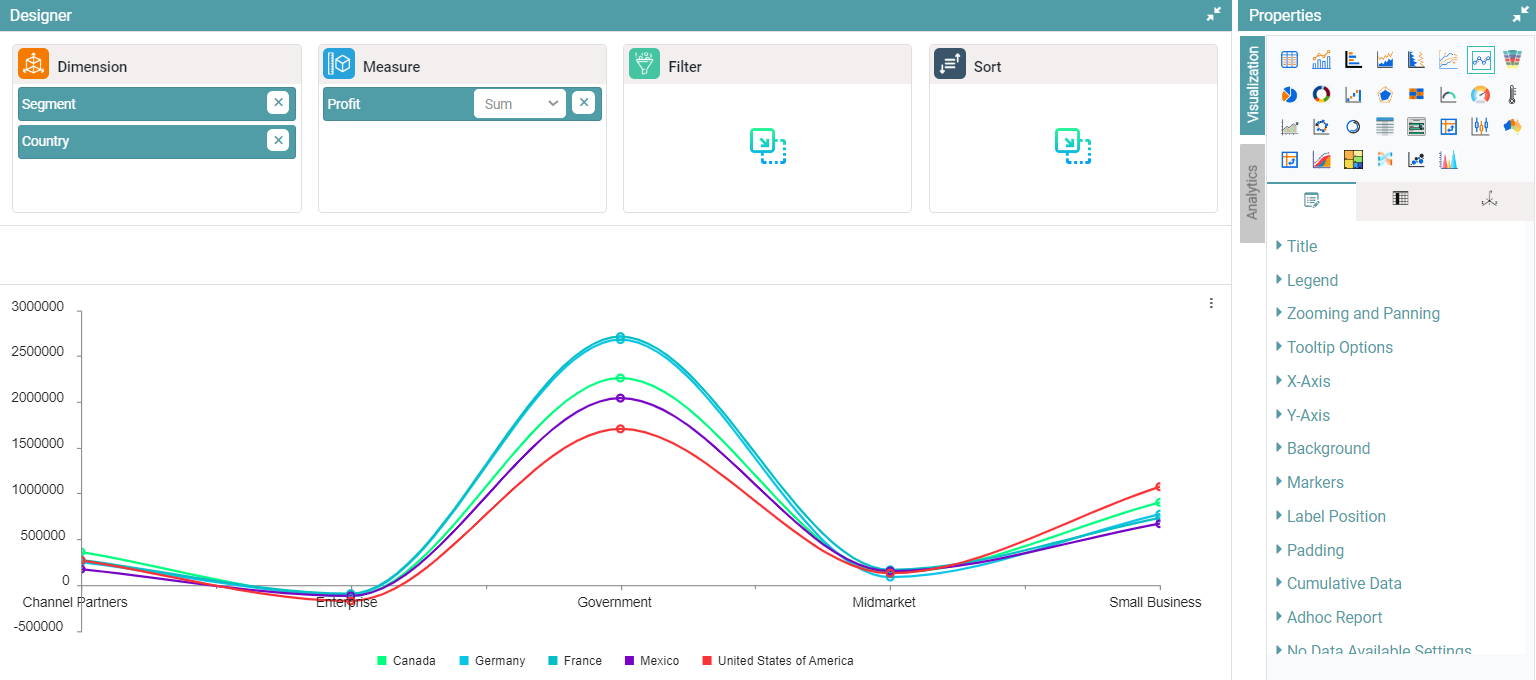
Step 2: Drag and drop the required columns in dimension and measure. The data represented will be a Line Chart. (Refer to the image below).


Properties
Line Style
Step 1: On the top right corner of the page, click on visualization under properties. Click on the Line Chart icon under properties.
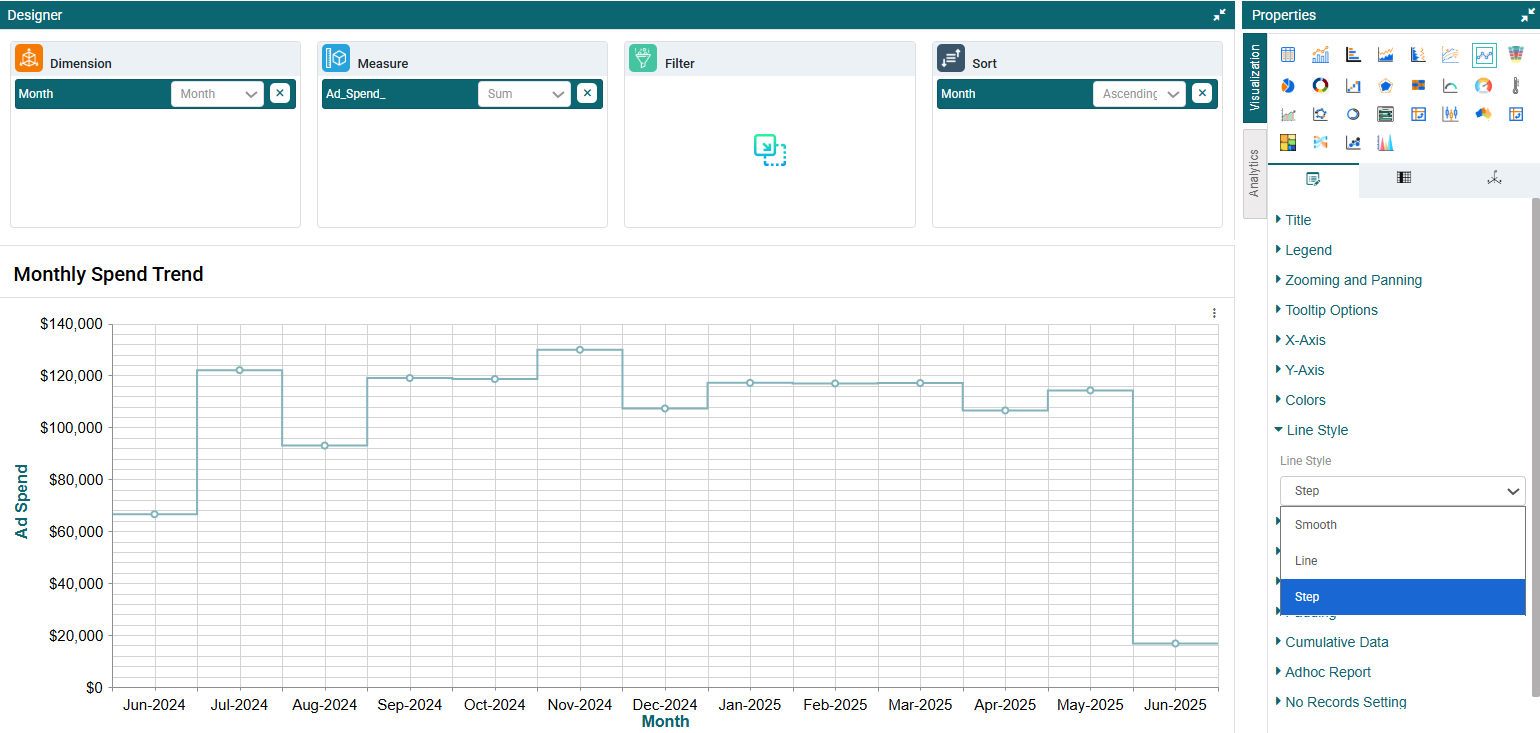
Step 2: Navigate to the Line Style option.
Step 3: Choose a line visual type from the available options — Smooth, Line, or Step. (Refer to the image below).
Markers
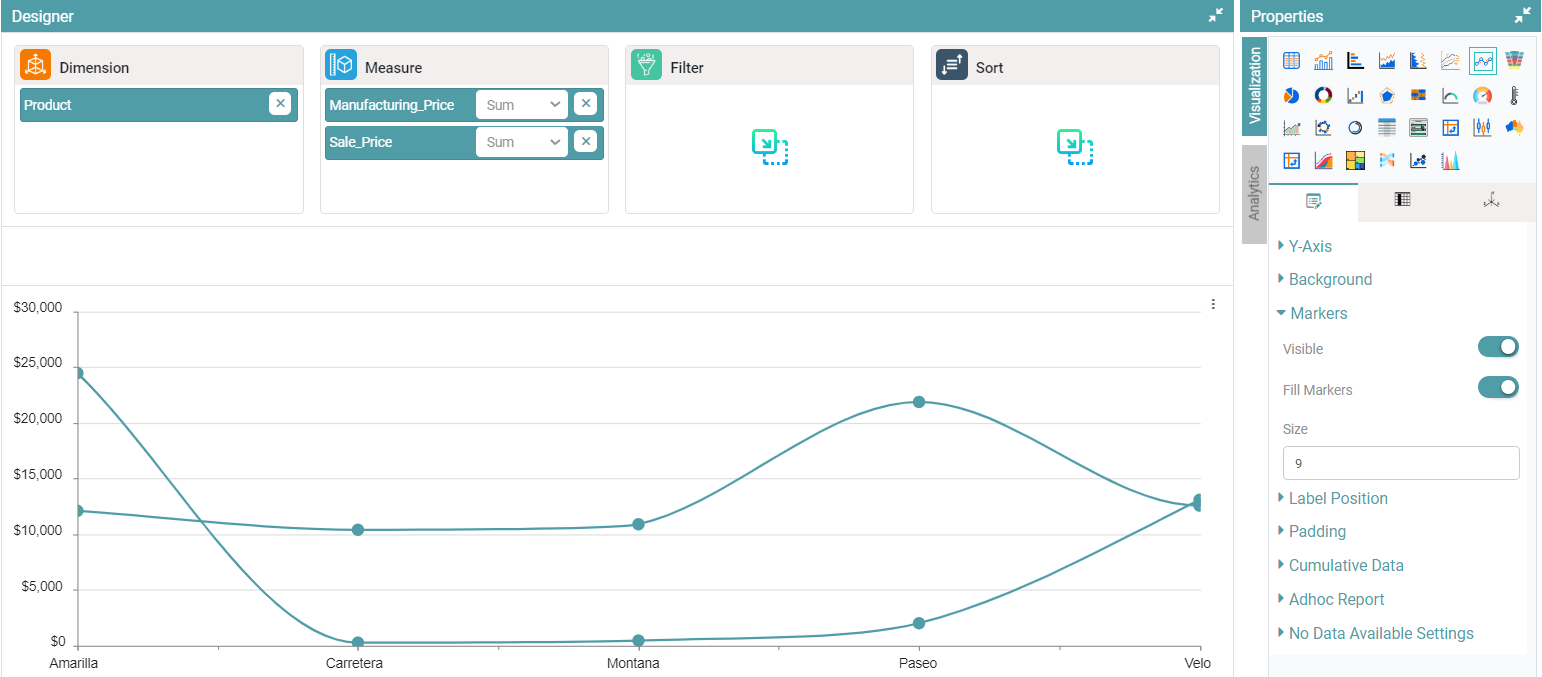
Step 1: On the top right corner of the page, click on visualization under properties. Click on the Line Chart icon under properties.
Step 2: Enable the ‘Visible’ toggle under ‘Markers’ in properties. You can also adjust the size of the markers in the chart. (Refer to the image below).
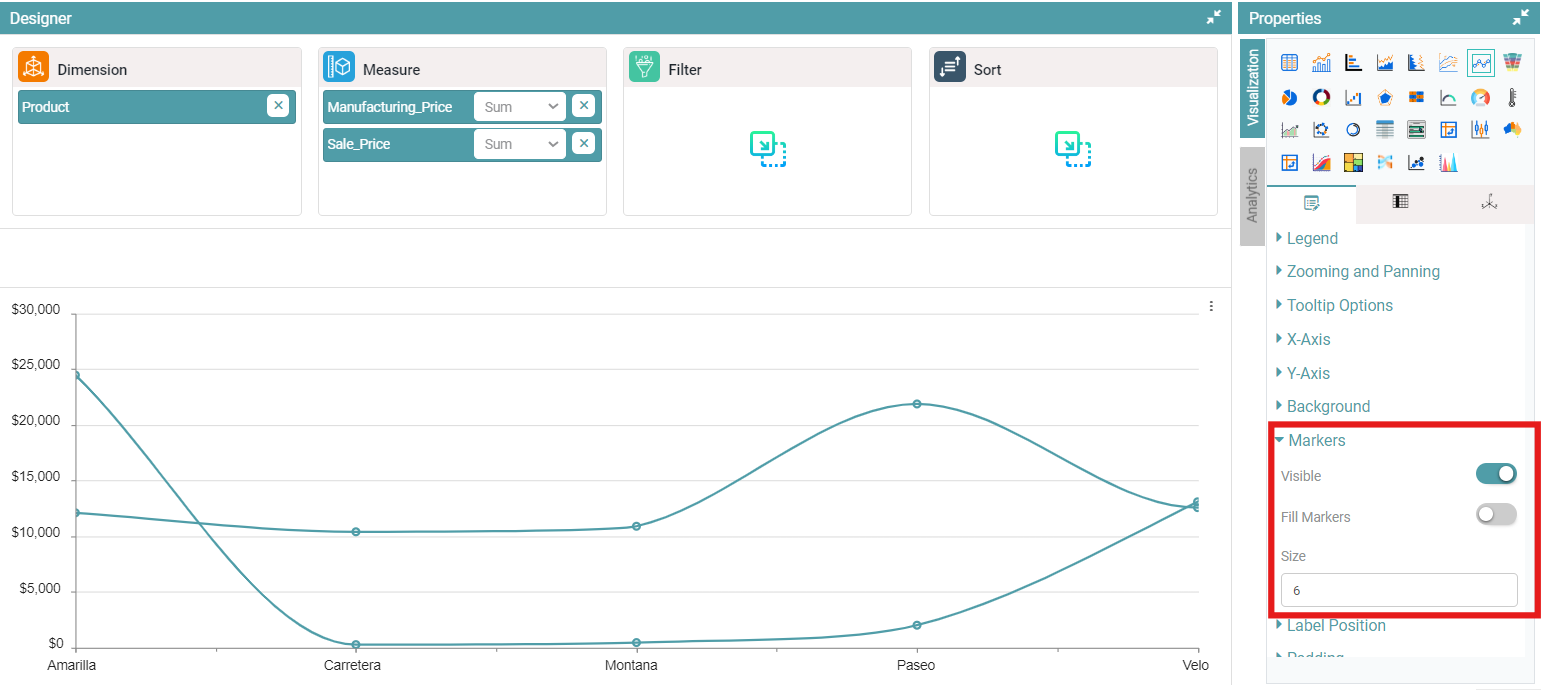
Step 3: You can fill the markers by enabling the Fill Markers toggle. (Refer to the image below).
Step 4: Disable the ‘Visible’ toggle under ‘Markers’ in properties. The markers will no longer visible on the chart.
Note: Other Properties are similar to that of the Bar Chart.
Columns
Columns are like that of the Bar Chart.