Creating a Linear Gauge Chart
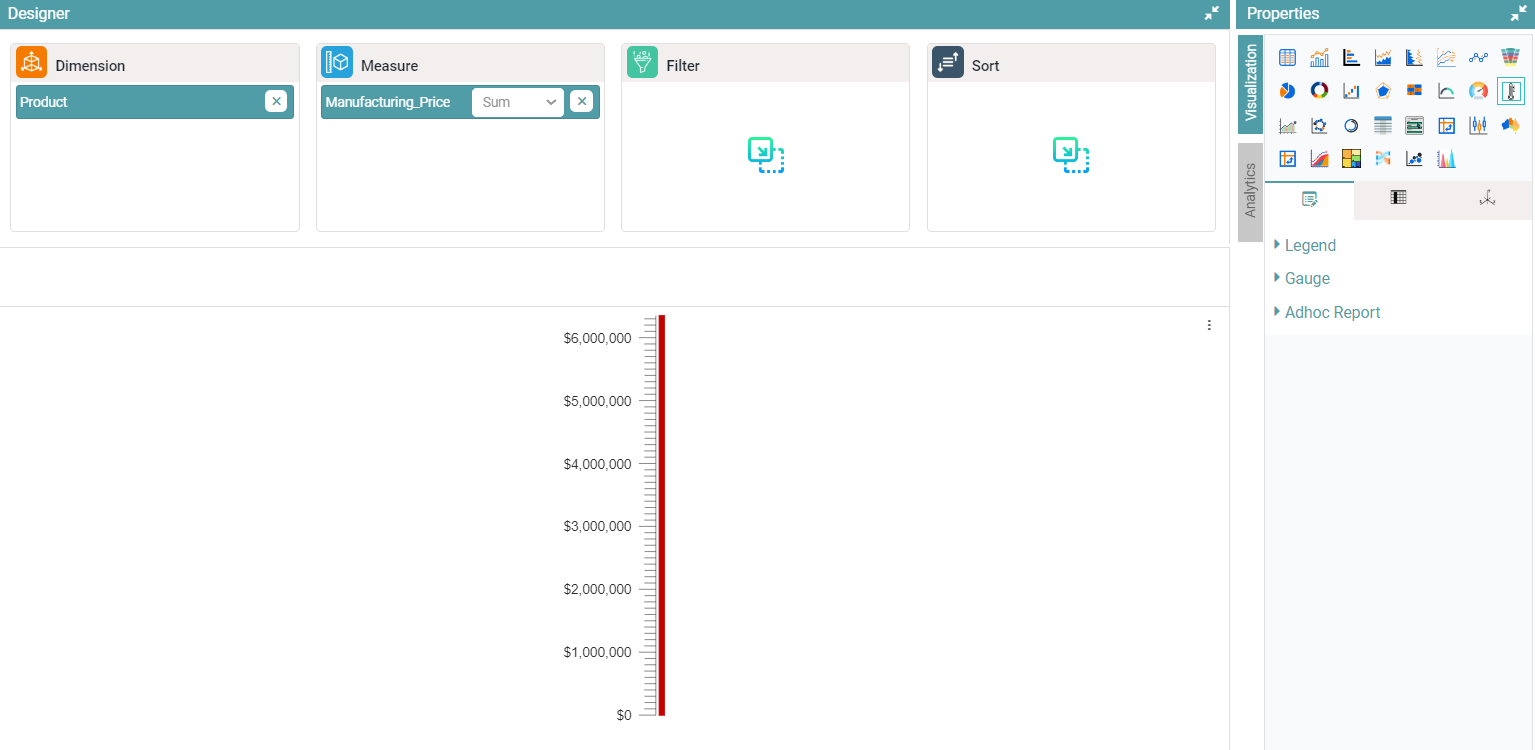
Step 1: On the top right corner of the page, click on visualization under properties. Click on the Linear Gauge Chart icon under properties. (Refer to the image below).

Step 2: Drag and drop the required columns in dimension and measure. The data is represented in the form of a Linear Gauge chart. (Refer to the image below).


Properties
Gauge
Step 1: On the top right corner of the page, click on visualization under properties. Click on the Linear Gauge Chart icon under properties. (Refer to the image below).

Step 2: Drag and drop the required columns in dimension and measure.
Step 3: Enter the minimum and maximum value under Gauge. The chart will be represented in accordance with the values entered. (Refer to the image below).
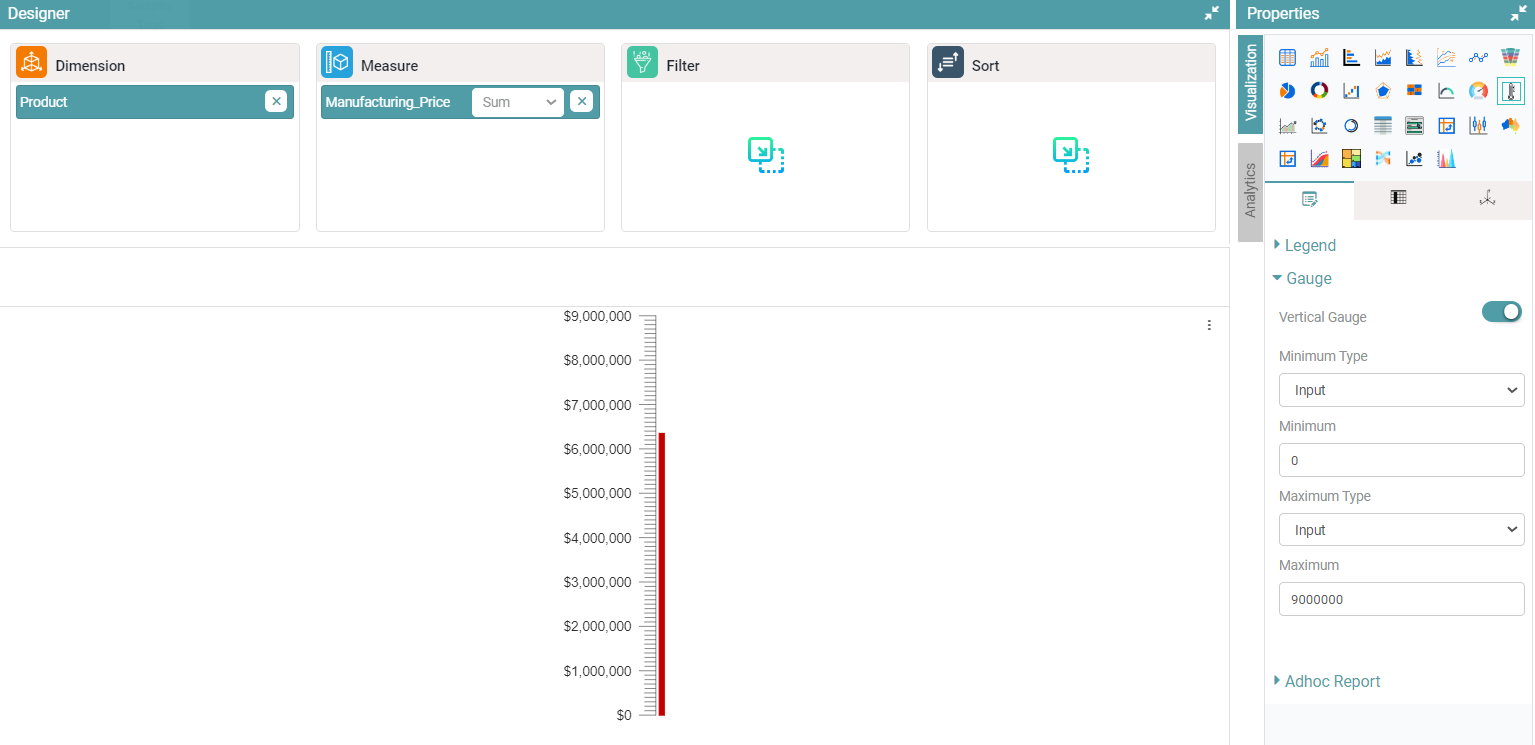
Note: Other Properties are similar to that of the Bar Chart.
Columns
Columns are similar to that of the Bar Chart.