Creating a Radial Gauge Chart
Step 1: On the top right corner of the page, click on visualization under properties. Click on the Radial Gauge Chart icon under properties. (Refer to the image below).

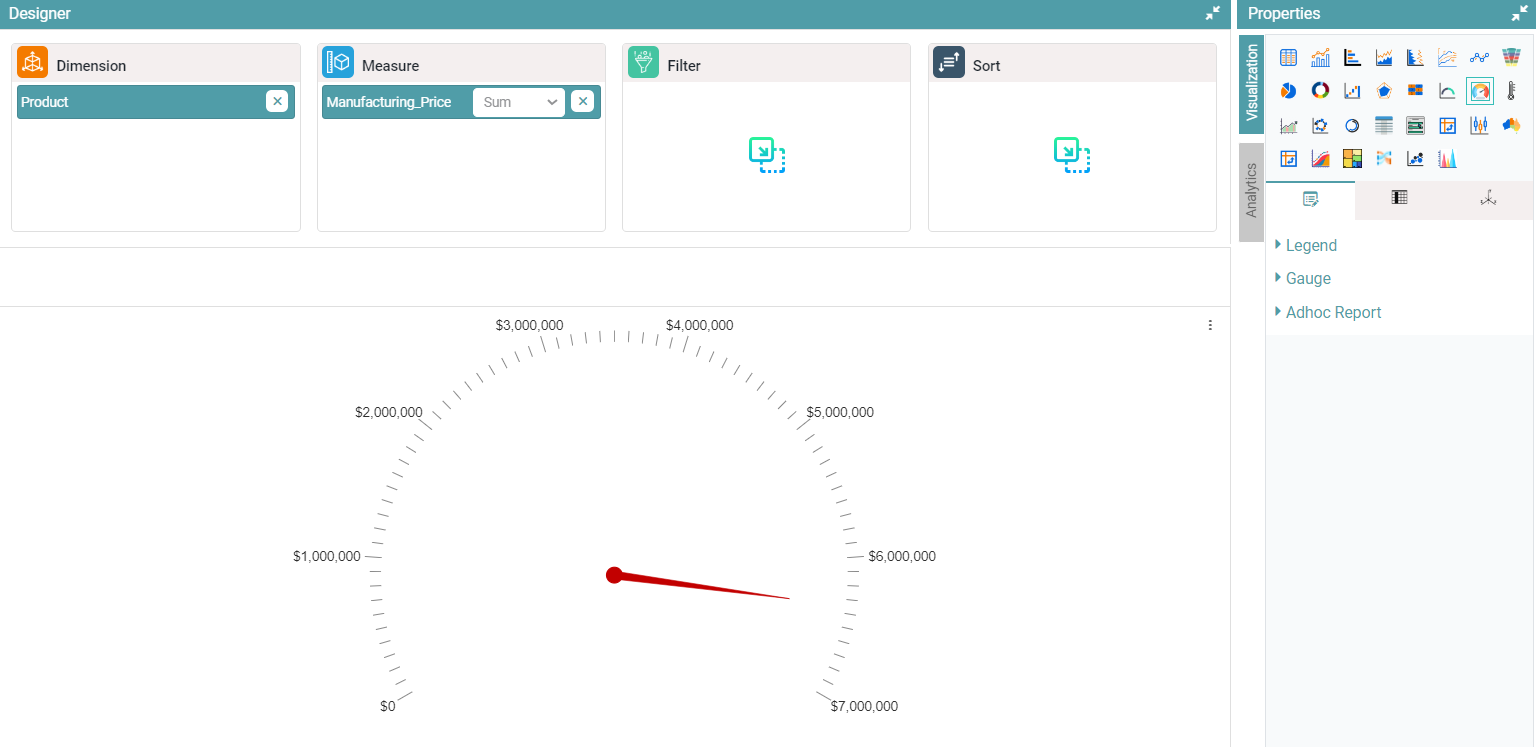
Step 2: Drag and drop the required columns in dimension and measure. The data is represented in the form of a Radial Gauge chart. (Refer to the image below).


Properties
Properties are similar to that of the Bar Chart.
Gauge
Step 1: On the top right corner of the page, click on visualization under properties. Click on the Radial Gauge Chart icon under properties. (Refer to the image below).

Step 2: Drag and drop the required columns in dimension and measure.
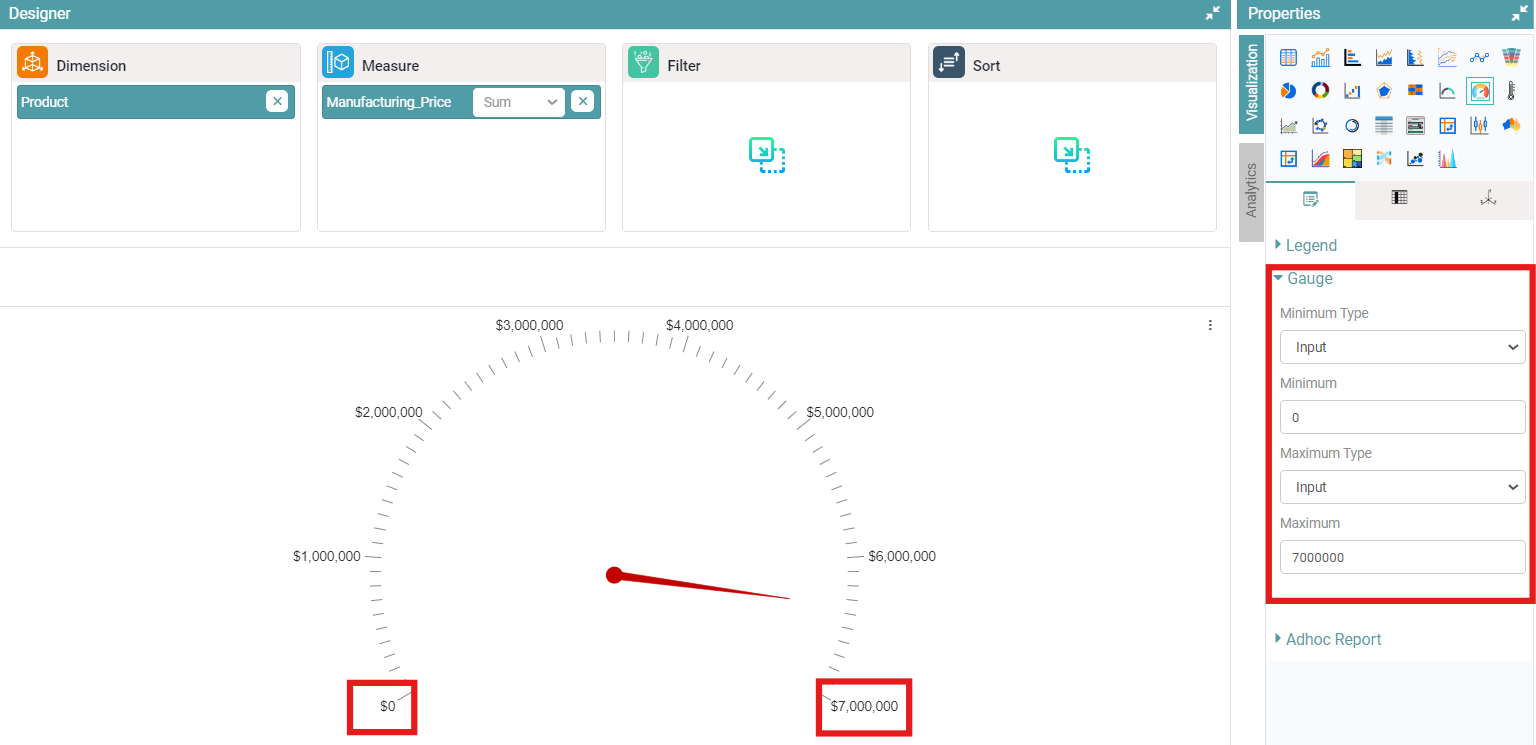
Step 3: Enter the minimum and maximum value under Gauge. The chart will be represented in accordance to the values entered. (Refer to the image below).
Columns
Columns are similar to that of the Bar Chart.