Overview
A Sankey Chart is a visualization that displays the flow of data between multiple stages or categories. It uses nodes and links to represent how values move or transition from one state to another, making it useful for analyzing distributions, conversions, and process flows.
Creating a Sankey Chart
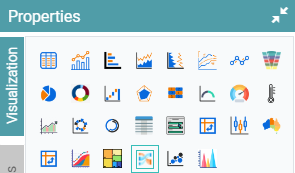
Step 1: On the top right corner of the page, click on visualization under properties. Click on the Sankey Chart icon under properties. (Refer to the image below).
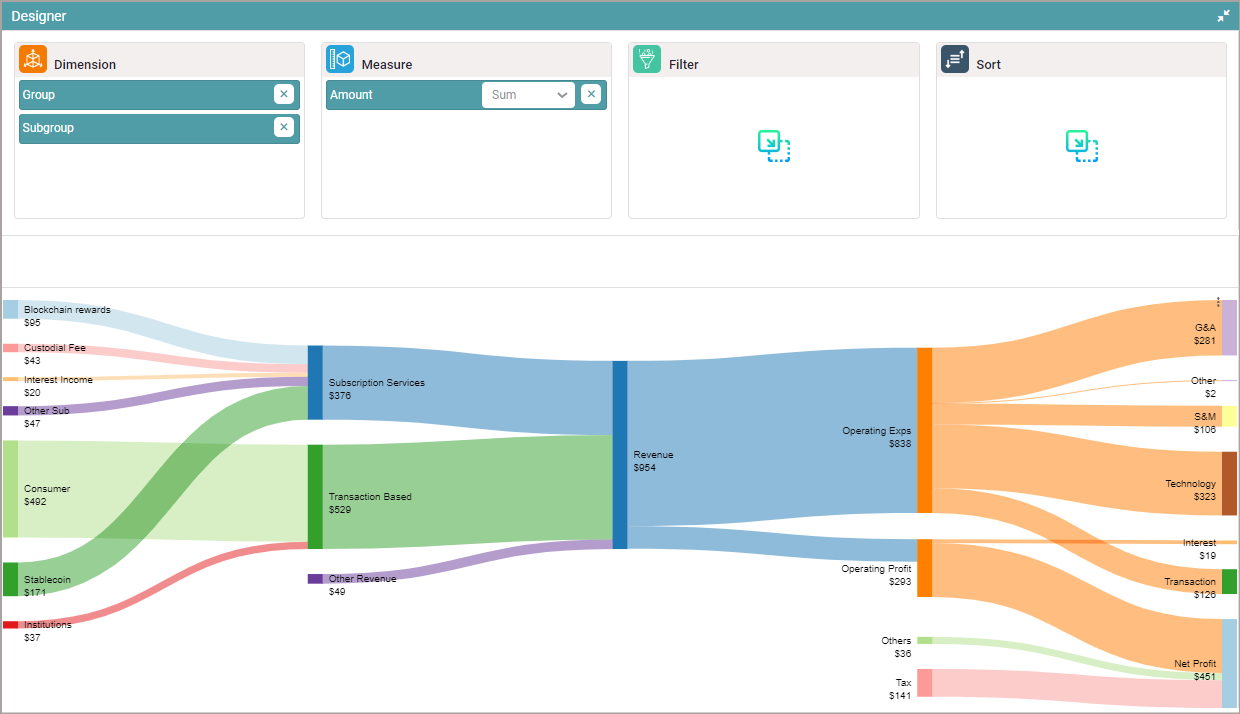
Step 2: Drag and drop the required columns in dimension and measure. The data is represented as a Sankey Chart. (Refer to the image below).


Properties
Color Properties
| Property | Description |
|---|---|
| Gradient | Enables gradient coloring for links. The gradient start color corresponds to the source node, and the end color corresponds to the target node. |
Stage Properties
| Property | Description |
|---|---|
| Number of Stages | Defines the total number of stages to display in the chart. |
| Stage Width | Controls the width allocation for each stage. Options include Equal Width (default) or Custom Width for manual configuration of individual stage widths. |
Label Position Properties
| Property | Description |
|---|---|
| Distinct Axis Label Formats | When enabled, allows separate CSS styling for the text and value portions of the label. |
Node Properties
| Property | Description |
|---|---|
| Highlight Full Path | When hovering over a node or link, highlights the complete path from the first stage to the selected node or link. |
| Highlight On Click | When enabled, clicking a node or link adds a border to the complete path. |
| Default Link Style | Provides a separate styling section for each link in the layout. |
| Bottom Leaf Node | Specifies a node name that should appear at the bottom of its stage when it is a leaf node. |
| Reduce Selected Link Width | When enabled, reduces the link width of the node specified in Bottom Leaf Node to 50%. |
| Node Width | Controls the width of all nodes in the chart. |
| Node Spacing | Defines the spacing between nodes within each stage. |
Other Properties are similar to that of the Table and Bar chart properties.
Columns
| Property | Description |
|---|---|
| Drilldown | Enables separate drilldown configurations for each node. |
| Label Position | Sets the label position for each column, either to the left or right of the node. Note: The first and last columns have fixed label positions. |
Other Columns are the same as Table and Bar chart properties and columns.