Creating a Semi Gauge Chart
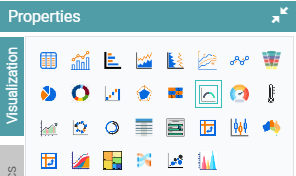
Step 1: On the top right corner of the page, click on visualization under properties. Click on the Semi Gauge Chart icon under properties. (Refer to the image below).
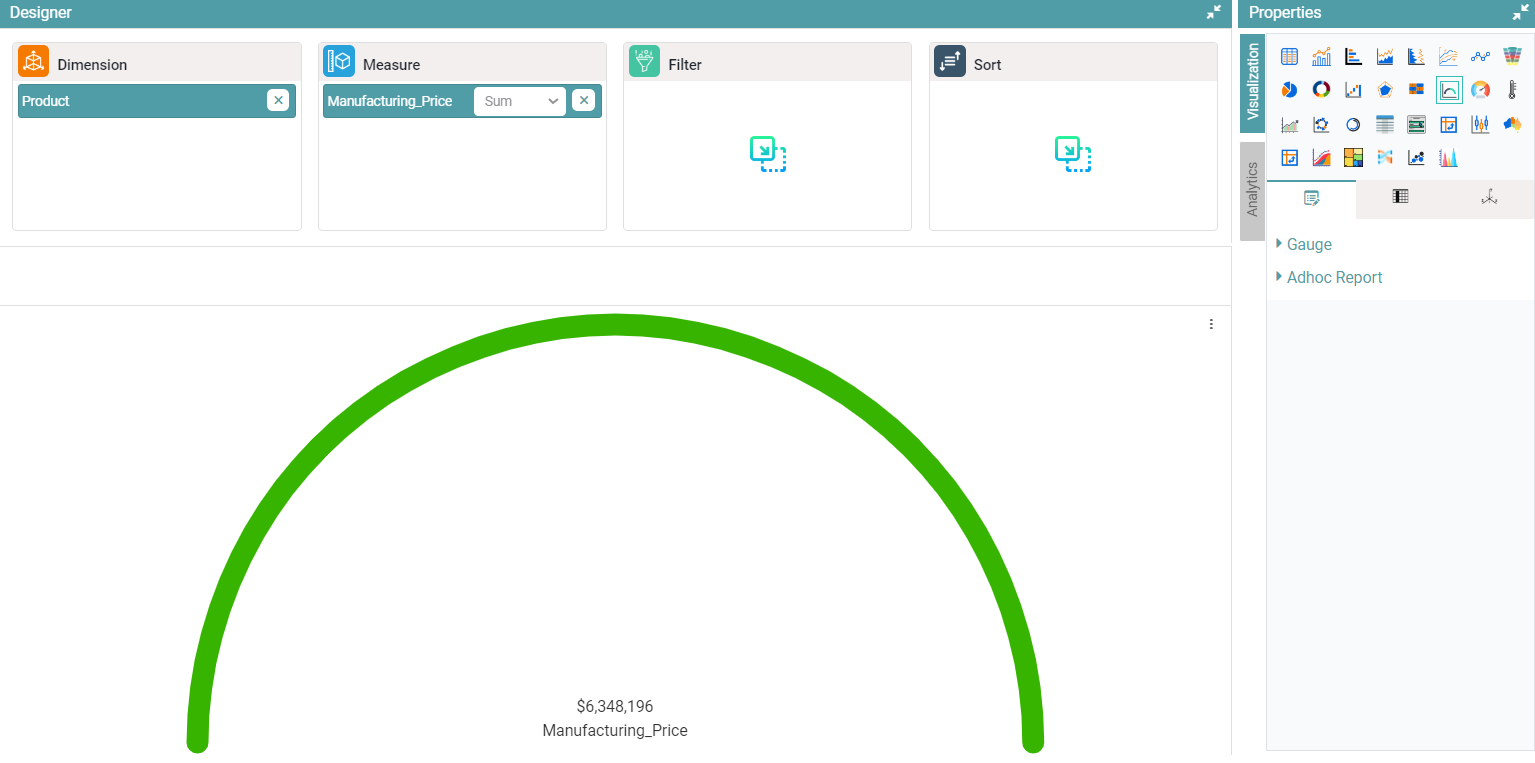
Step 2: Drag and drop the required columns in dimension and measure. The data is represented in the form of a Semi Gauge chart. (Refer to the image below).


Properties
Gauge
Step 1: Click on properties in Visualization.
Step 2: Click on Gauge. You are able to enable percentage and change the font color.
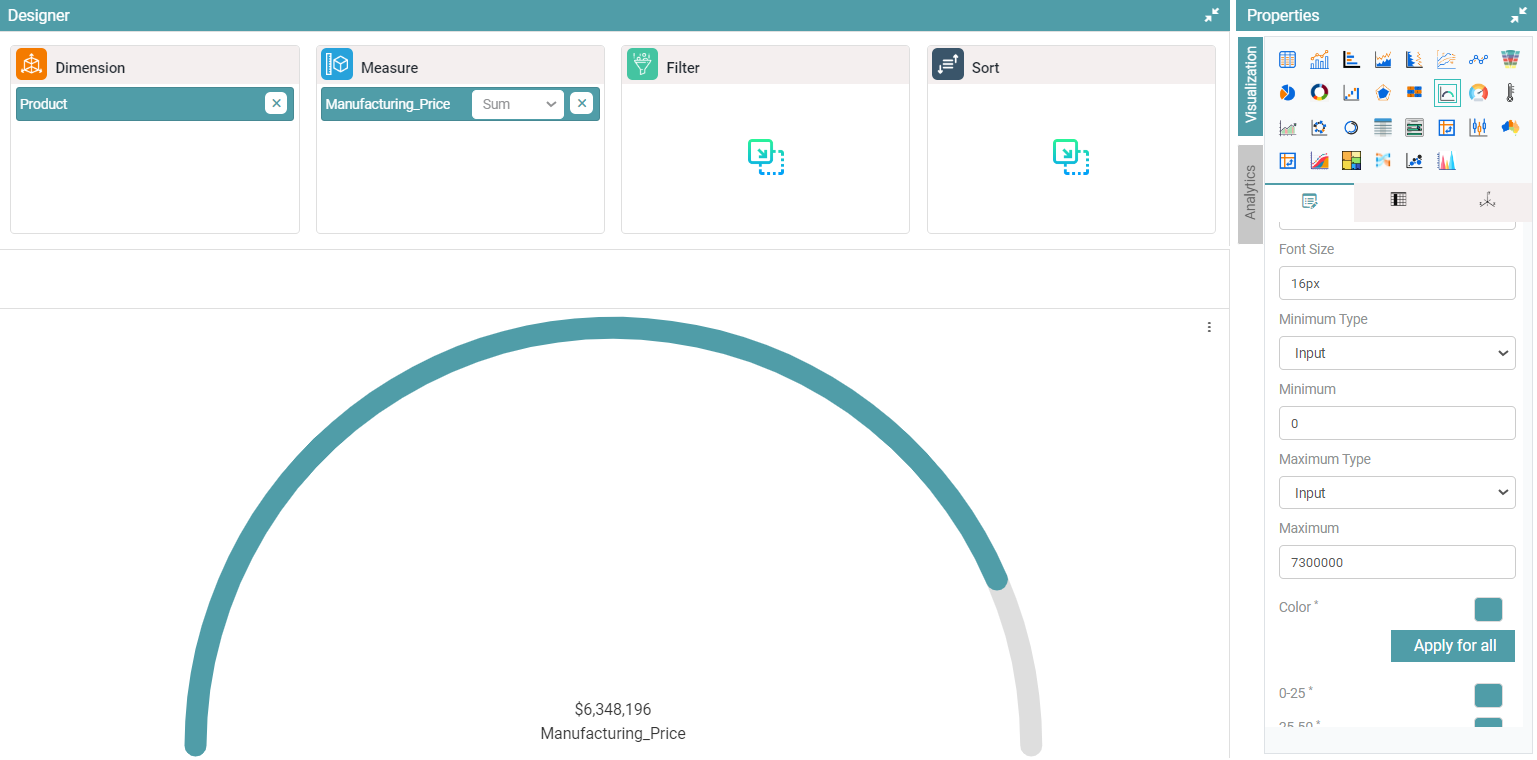
Step 3: Enter minimum and maximum value. Select the required color for ranges. (Refer to the image below).

Step 4: Chart will be displayed based on the selected color for the respective range. (Refer to the image below).
Miscellaneous
This is the same as Bar Chart and Table Chart.
Columns
Columns are the same as table, bar and pie chart columns.