Creating a Tree List
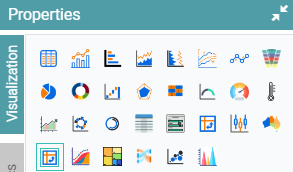
Step 1: On the top right corner of the page, click on visualization under properties. Click on the Tree List icon under properties. (Refer to the image below).
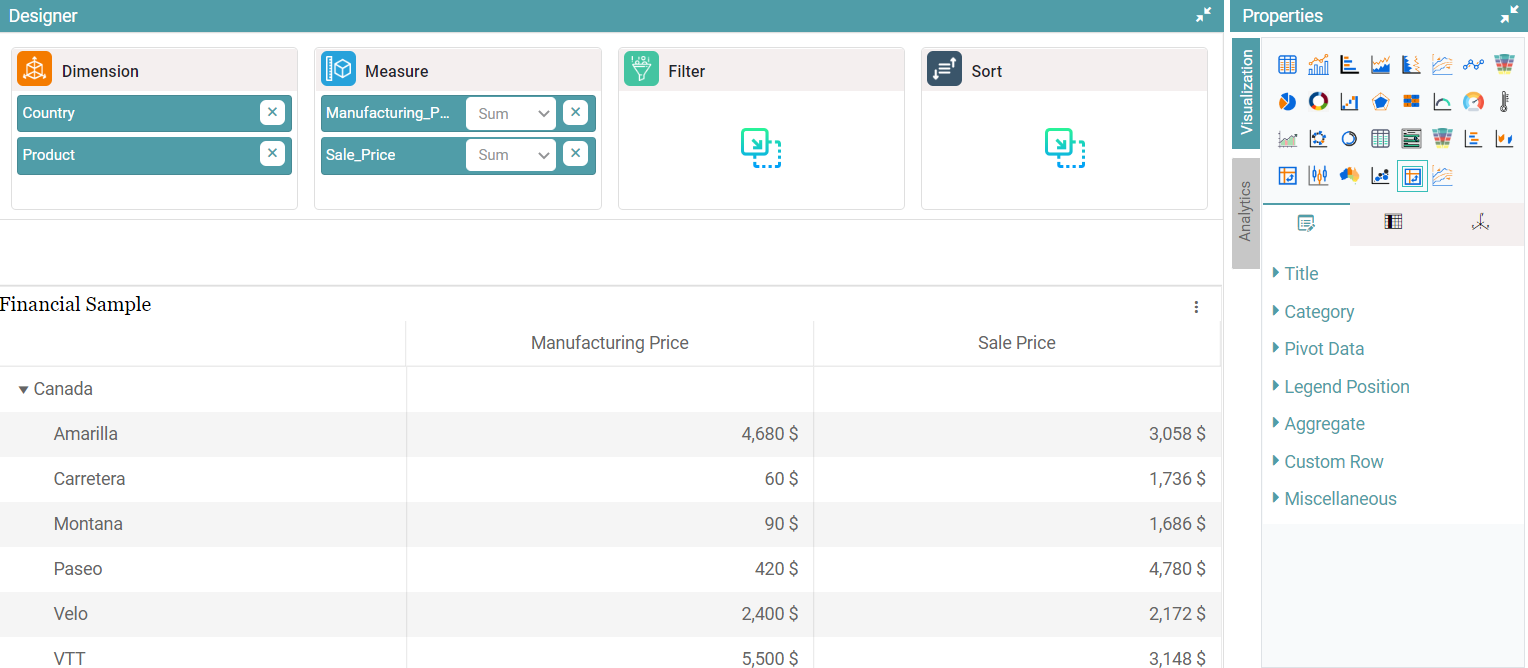
Step 2: Drag and drop the required columns in dimension and measure. The data is represented in the form of a Tree List Chart. (Refer to the image below).


Properties
Tree List
Step 1: On the top right corner of the page, click on visualization under properties. Click on the Tree List icon under properties.
Step 2: Drag and drop the required columns in dimension and measure. The data is represented in the form of a Tree List Chart.
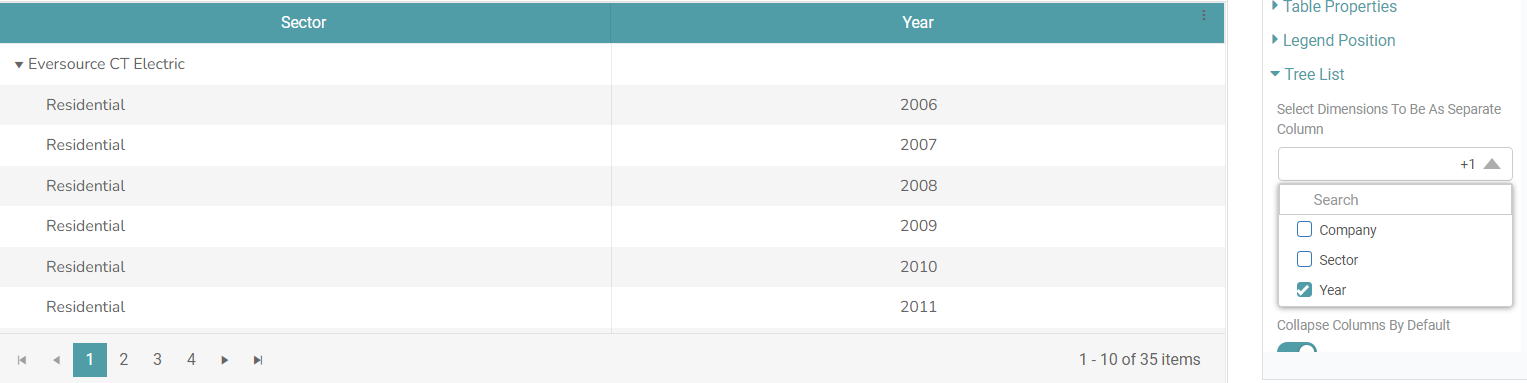
Step 3: Locate the “Tree List” option under properties. Here, you can select the dimensions that you want to be in a separate column. (Refer to the image below).
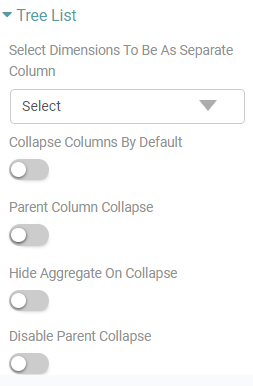
Step 4: There are several other options that are available under the tree list like “Collapse Column by Default, Parent Column Collapse, Hide Aggregate on Collapse, Disable Parent Collapse”. (Refer to the image below).
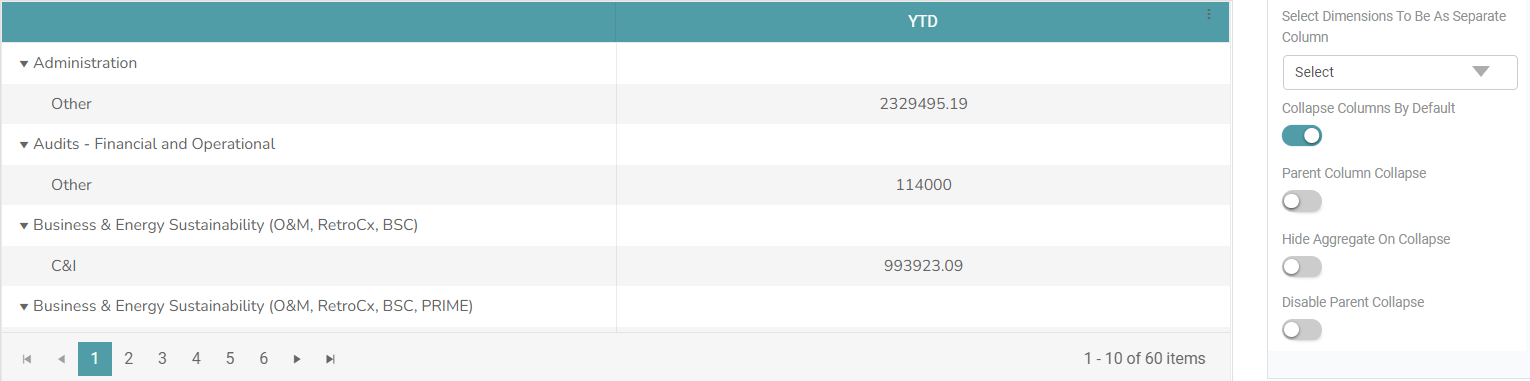
Step 5: You can toggle the collapse columns on default option. What this does is that all the columns of the tree list remain in a collapsed position. (Refer to the image below).
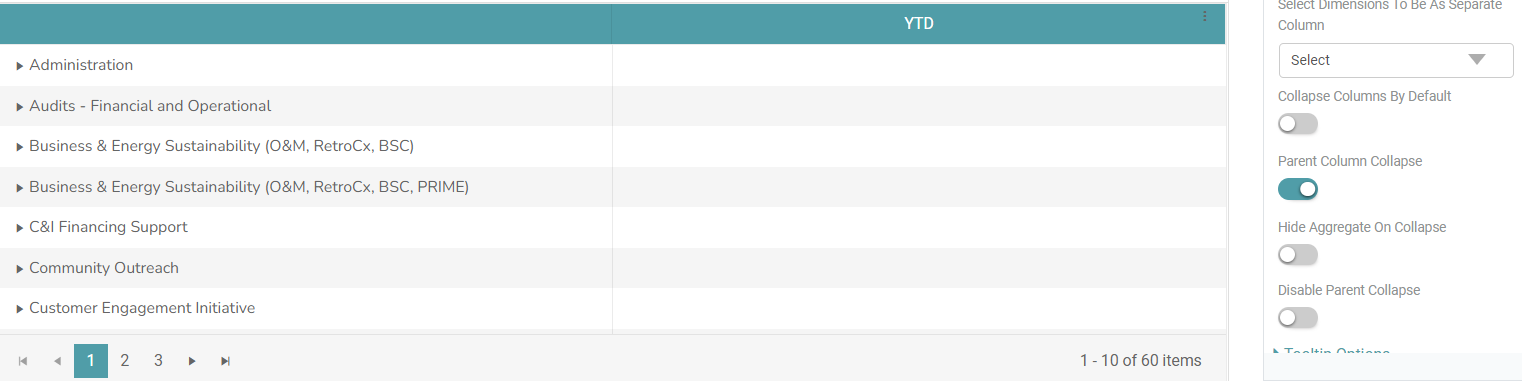
Step 6: If you want to show only the parent row of the tree list, then click on the parent column collapse toggle. (Refer to the image below).
Step 7: You can also hide the aggregate total of the child that is displayed next to the parent. Toggle the Hide Aggregate on Collapse toggle. (Refer to the image below).
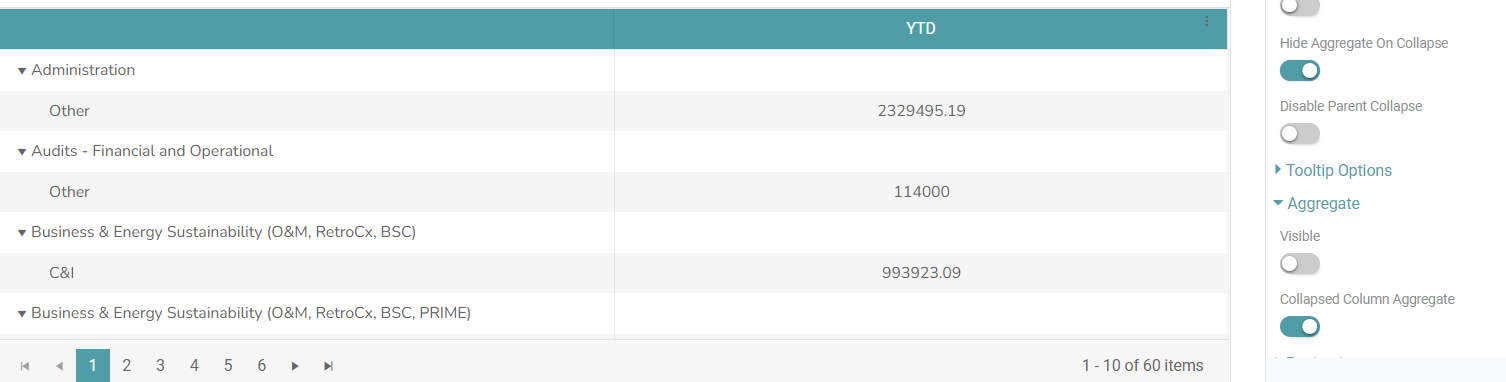
Step 8: To show the aggregate total next to the child, toggle the Hide Aggregate on Collapse toggle off. (Refer to the image below).
Note: The collapsed column aggregate toggle needs to be toggled on for Step 7 & Step 8 to give results.
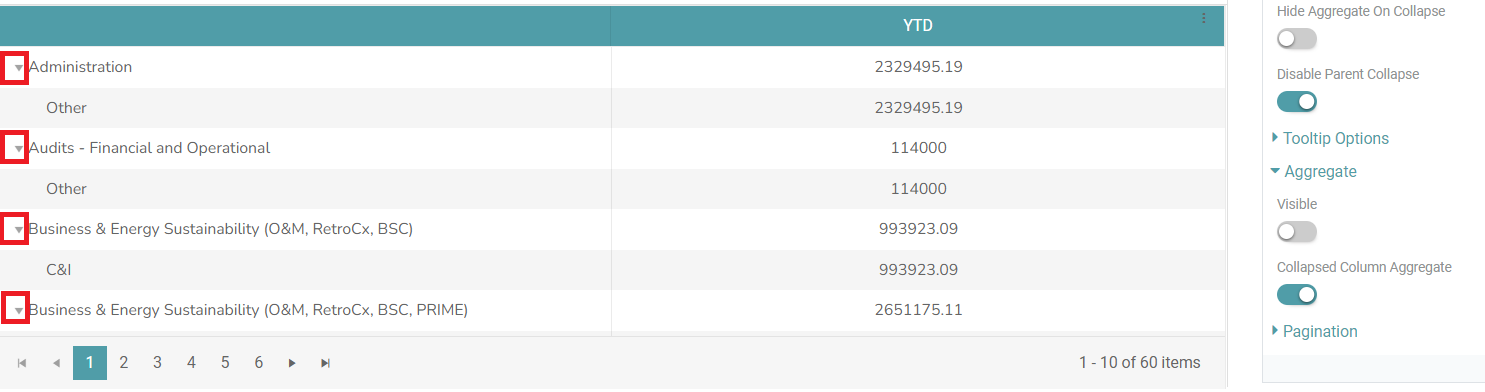
Step 9: If you do not want to close/ open the parent accordion and wish to freeze it, click on the “Disable Parent Collapse” toggle. The accordion will not be clickable. (Refer to the image below).
Aggregate
Step 1: On the top right corner of the page, click on visualization under properties. Click on the Tree List icon under properties.
Step 2: Drag and drop the required columns in dimension and measure. The data is represented in the form of a Tree List Chart.
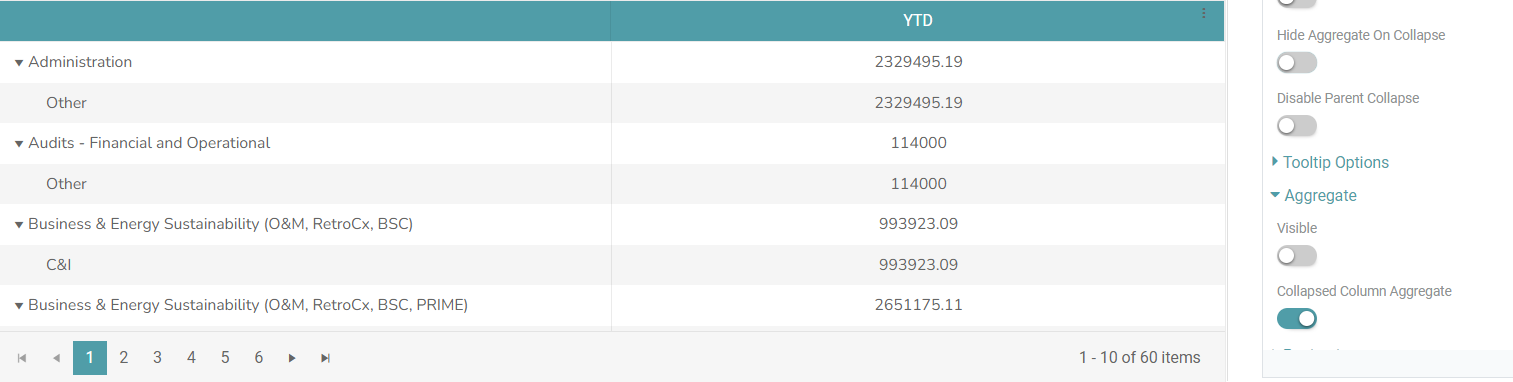
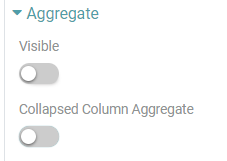
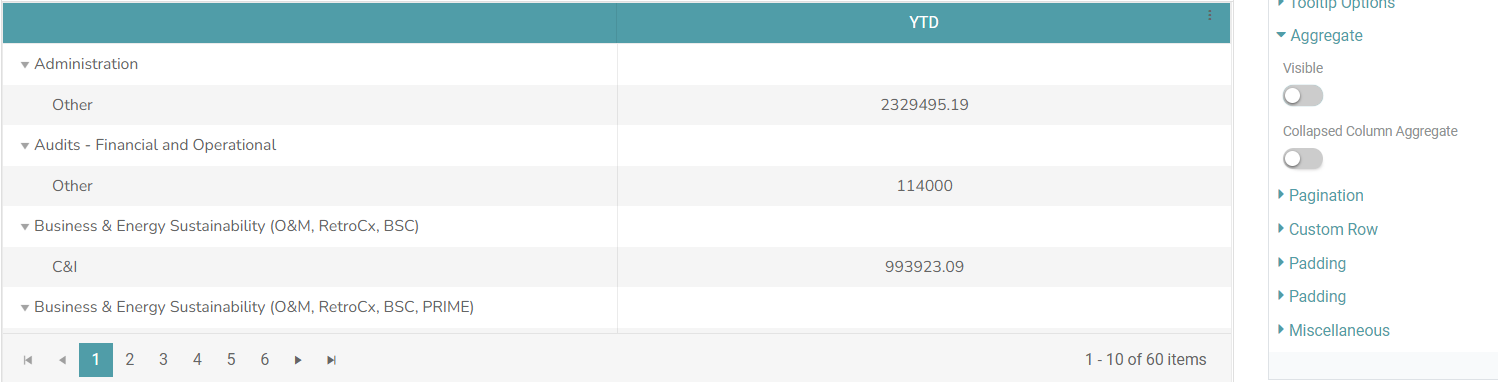
Step 3: Locate the “Aggregate” option under properties. There are various options under this and those are “Visible, Collapsed Column Aggregate and Aggregate Label”. (Refer to the image below).
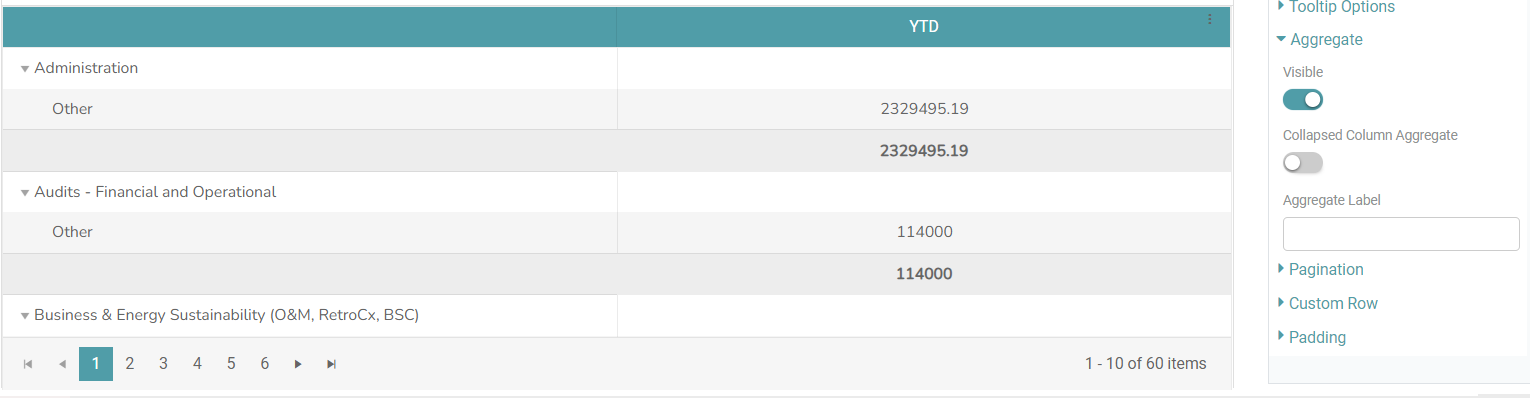
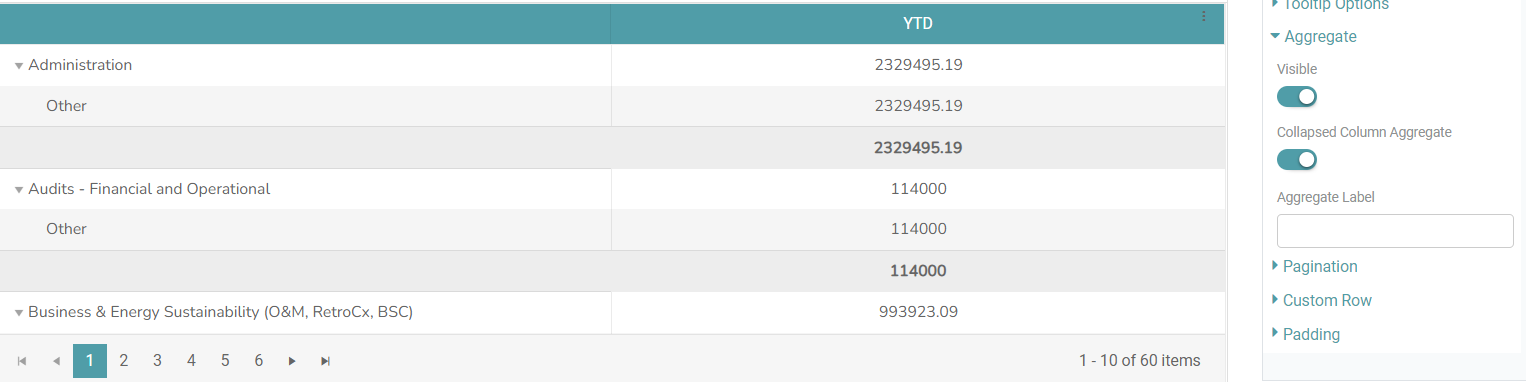
Step 4: If you toggle on the “Visible” toggle, the aggregate will be visible. And when you turn on the “Collapsed Column Aggregate” toggle then the aggregate will be visible. (Refer to the images below).
Step 5: Click on the “Visible” and “Collapsed Column Aggregate” again to toggle it off. (Refer to the image below).
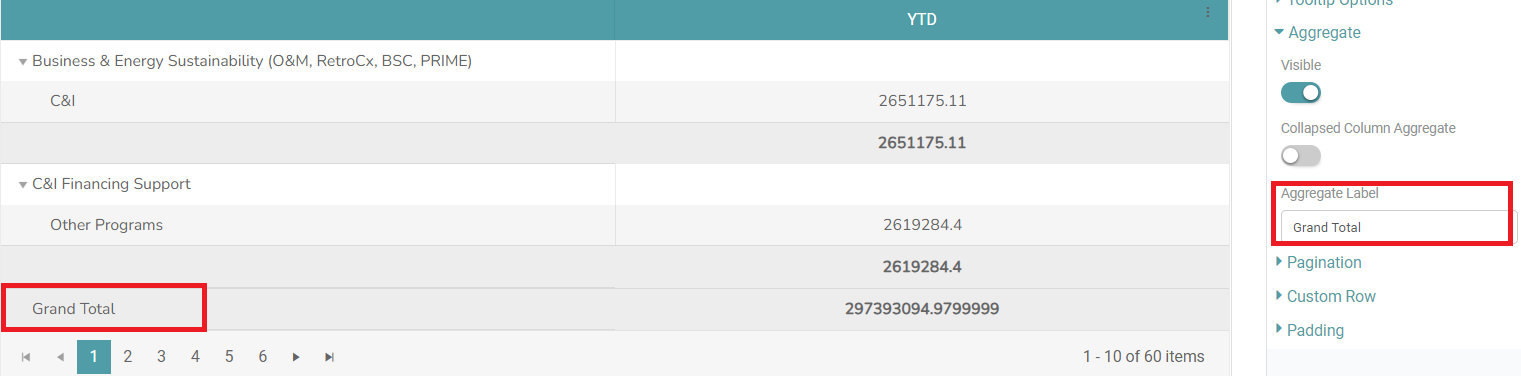
Step 6: You also have the option to establish the aggregate name by inputting your desired name in the Aggregate Label field. (Refer to the image below).
Other Properties are similar to that of the Table and Bar Chart properties.
Columns
Columns are the same as Table and Bar Chart properties and columns.