Creating a Tree Map
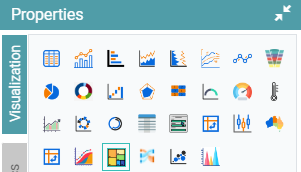
Step 1: On the top right corner of the page, click on visualization under properties. Click on the Tree Map icon under properties. (Refer to the image below).
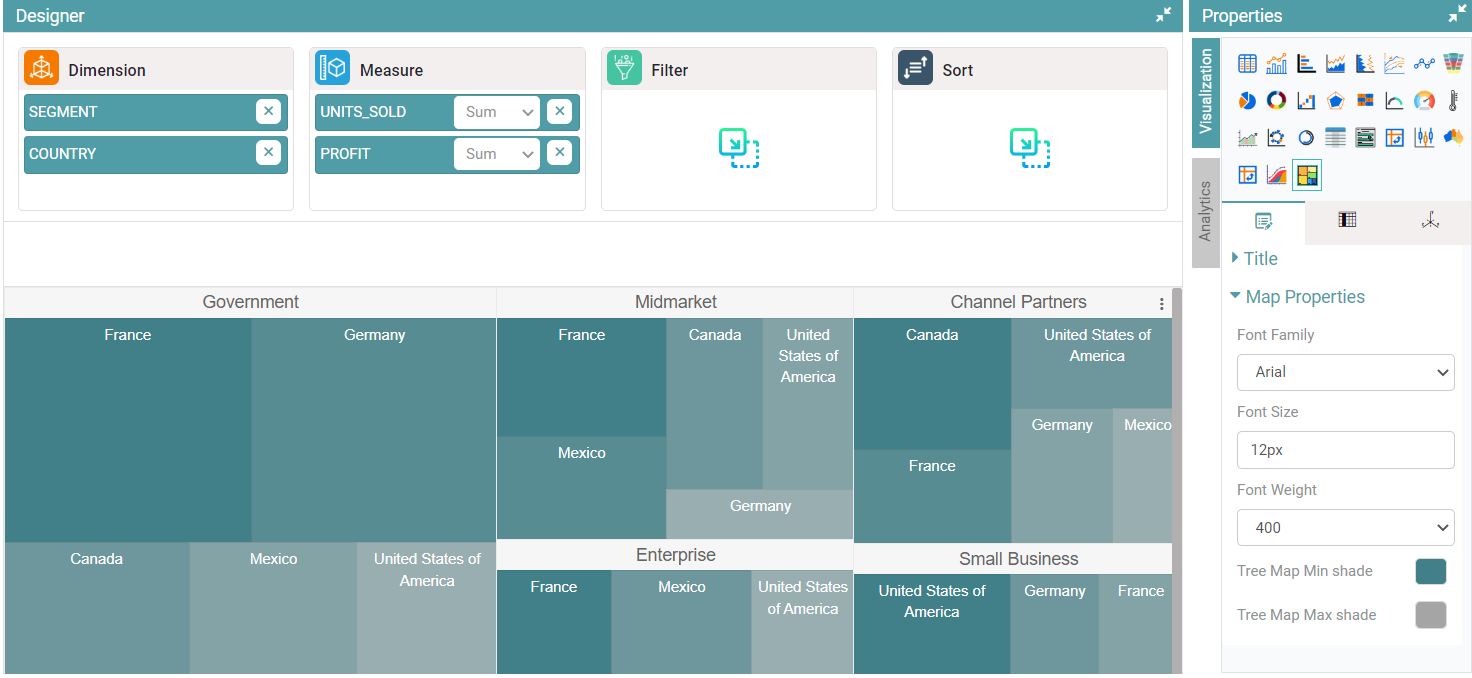
Step 2: Drag and drop the required columns in dimension and measure. The data is represented as a Tree Map.
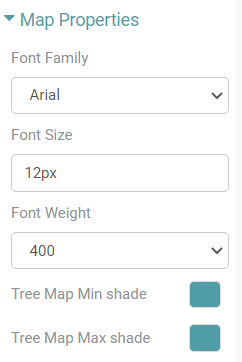
Step 3: Under properties click on Map Properties option. The user can choose the font family, font size, font weight and can choose the tree map min and max shade. (Refer to the images below).


Properties
Other properties similar to that of the Bar Chart and Table.