Create a Data Cube
Step 1: Click on the Design Tab on the Main Navigation bar.
Step 2: Click on Add New and Click on Folder.
Step 3: Now, enter the preferred name for the Folder and click on the Data cube icon.
Step 4: A new Data cube is created.
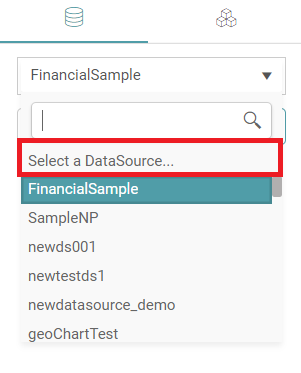
Step 5: Select the Datasource from the dropdown on your left. (Refer to the image below).


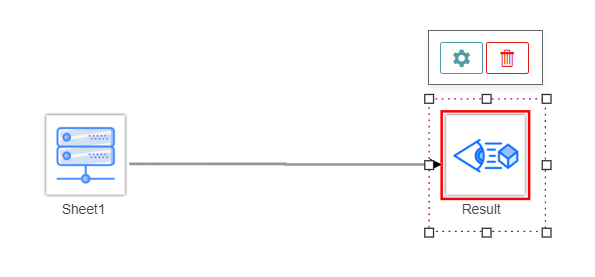
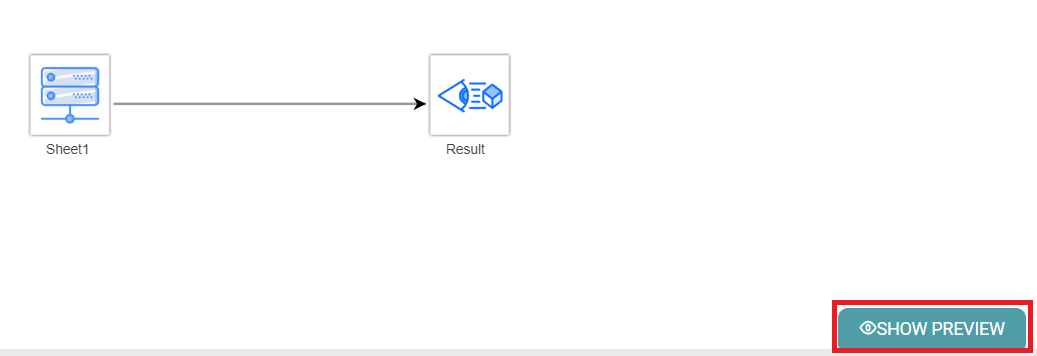
Step 6: Drag and drop the datasets to the main screen and click on Result.
Step 7: Click on the Settings icon. (Refer to the image below).
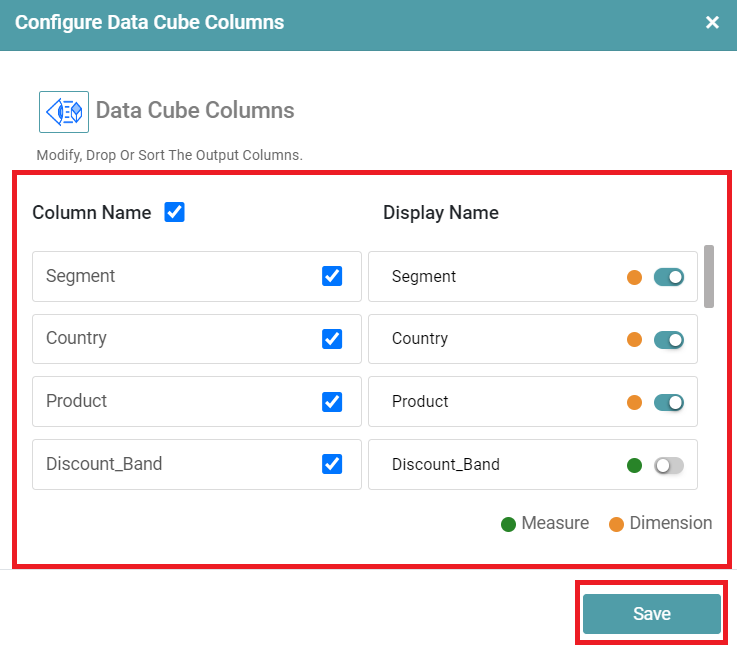
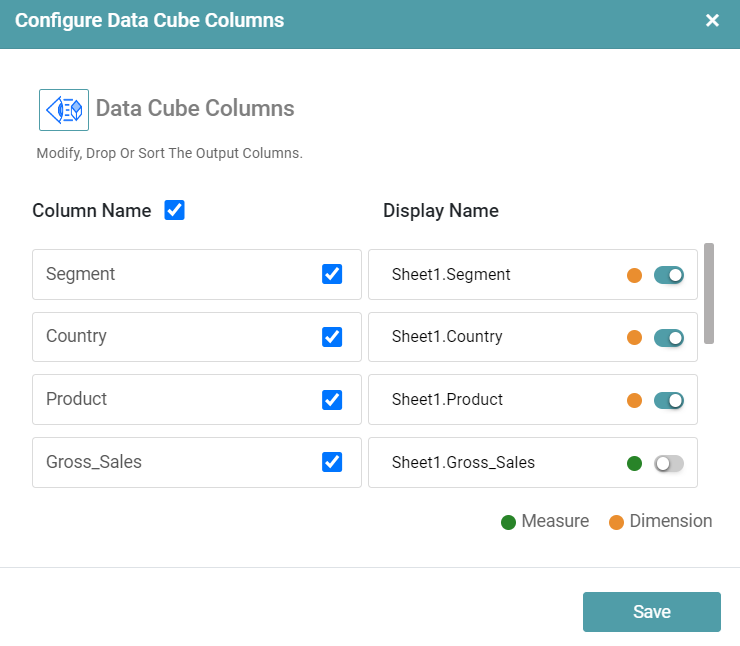
Step 8: Configure Data cube popup will appear. Select column name and display name from the popup.
Step 9: Click on the Save button. (Refer to the image below).
Step 10: Click on Show Preview. (Refer to the image below).
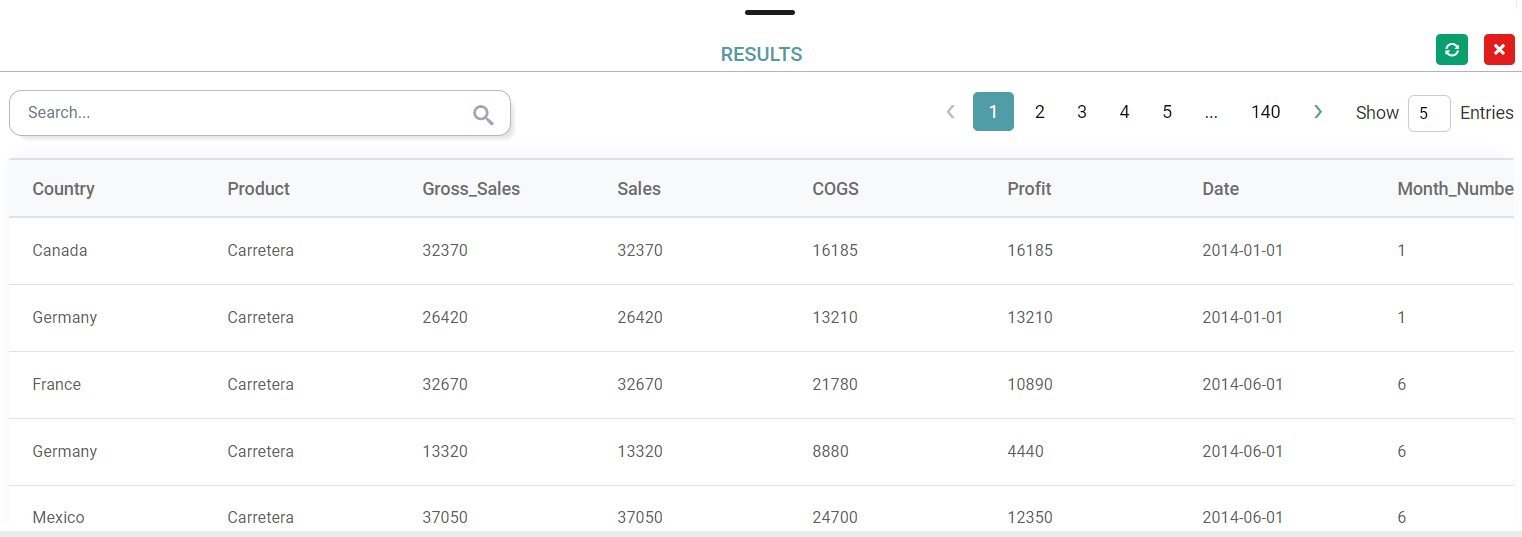
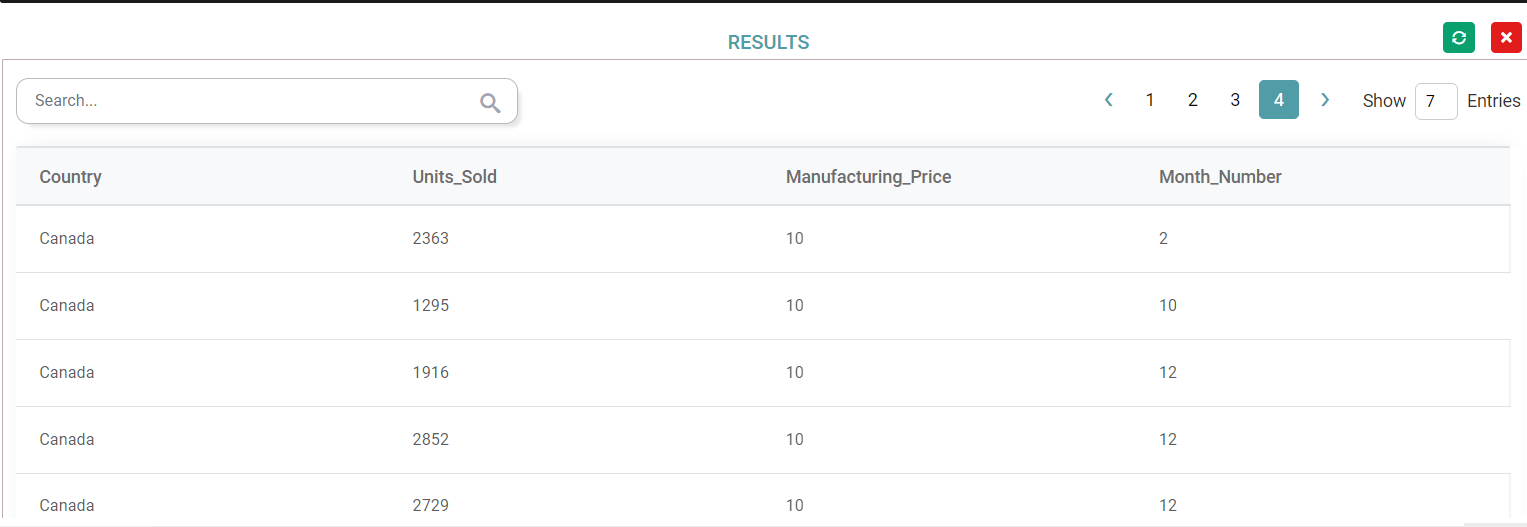
Step 11: The results will be displayed. (Refer to the image below).
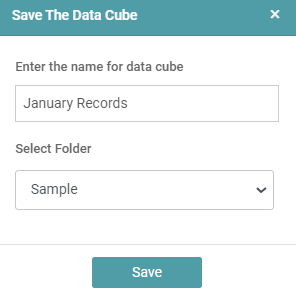
Step 12: Click on the close icon to close the results tab. Click on the save icon.
Step 13: Enter the Data cube name, select Folder and click on the Save button. The Data cube is saved with the given name. (Refer to the image below).
Actions
Save As
Step 1: Select any existing Data cube from the project list.
Step 2: Click on the save as icon.
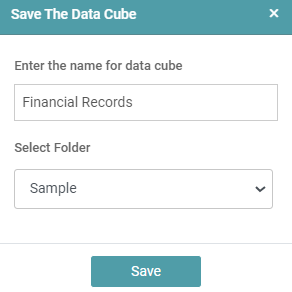
Step 3: Enter the Data cube name, select the Folder and click on the Save button.
Step 4: The data cube is saved under its original name, and an additional copy with the new name is added to the list of data cubes. (Refer to the image below).
Reset
Step 1: Drag and drop the datasets to the main screen.
Step 2: Click on the reset icon.
Step 3: A warning message popup will appear, click OK button.
Step 4: Then all the changes will be lost.
Refresh
If a user clicks on the refresh icon, then data is updated in Data cube screen.
Operations
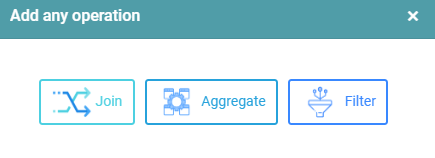
In Data cube, the user is able to perform 3 distinct operations. Those are:
- Join
- Aggregate
- Filter
(Refer to the image below).
Join
Step 1: Click on the line and click on the settings icon. (Refer to the image below).

Step 2: Select the Join operation in the popup.
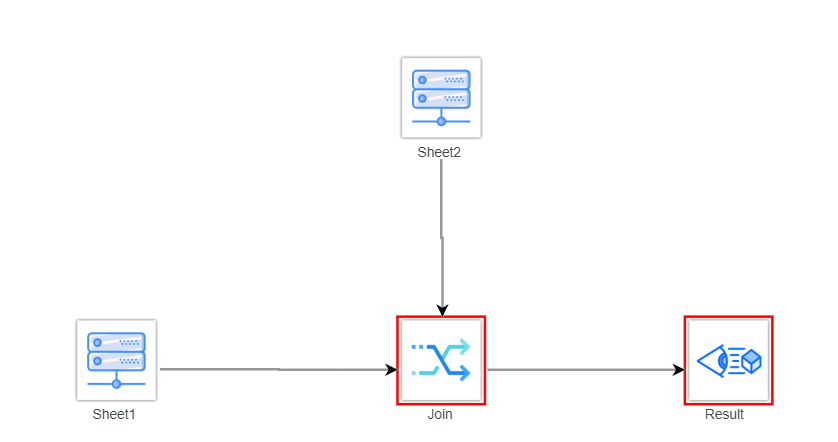
Step 3: Drag and drop another dataset onto the main screen.
Step 4: Join dataset sheets with join operation. (Refer to the image below).
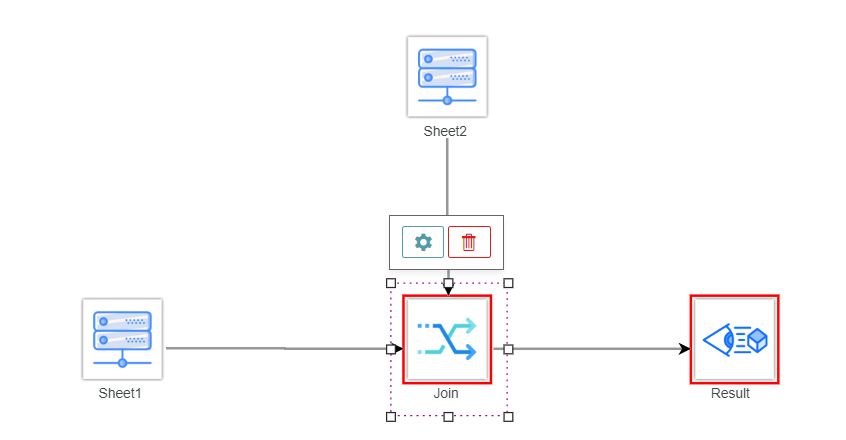
Step 5: Click on Join and click on the settings icon. (Refer to the image below).
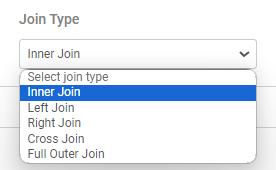
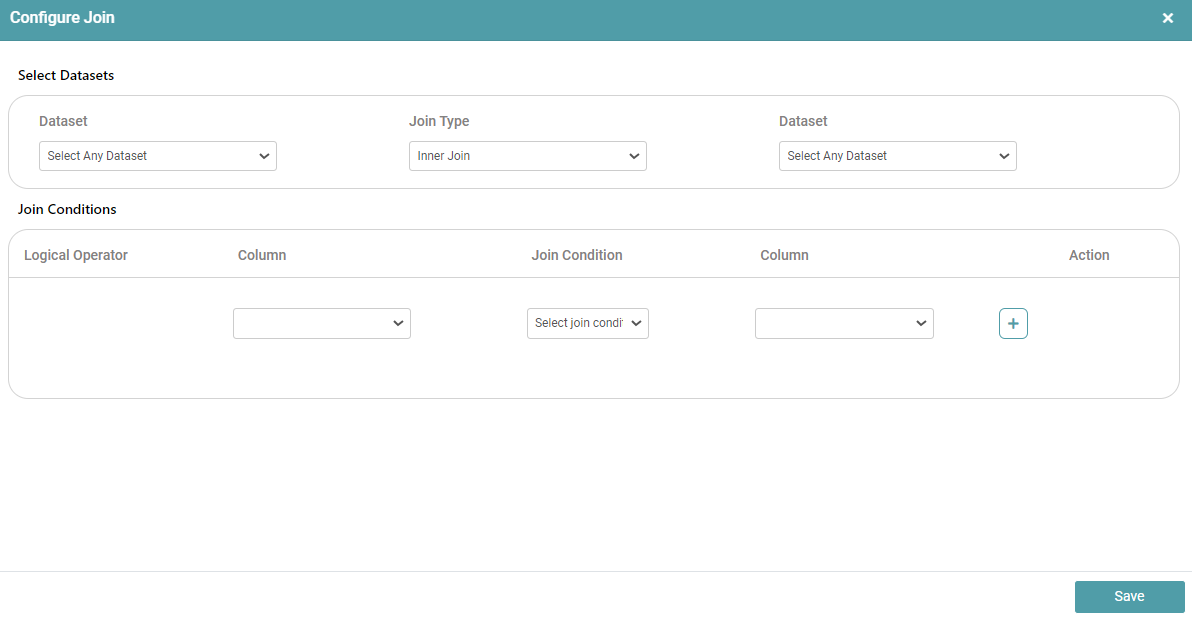
Step 6: In the configure join popup, select the join type and make the connection between the left table and right table.
Step 7: In join type, the user will be given five options to choose from.
- Inner Join.
- Left Join.
- Right Join.
- Cross Join
- Full Outer Join. (Refer to the images below).
Inner Join
Step 1: The user can select the inner join option from the join type dropdown and make the connection between two tables.
Step 2: Click on the save button.
Step 3: Click on Results and click on the settings icon.
Step 4: In the configure popup, select the column name and display name according to the user requirement.
Step 5: Click on Save. (Refer to the image below).
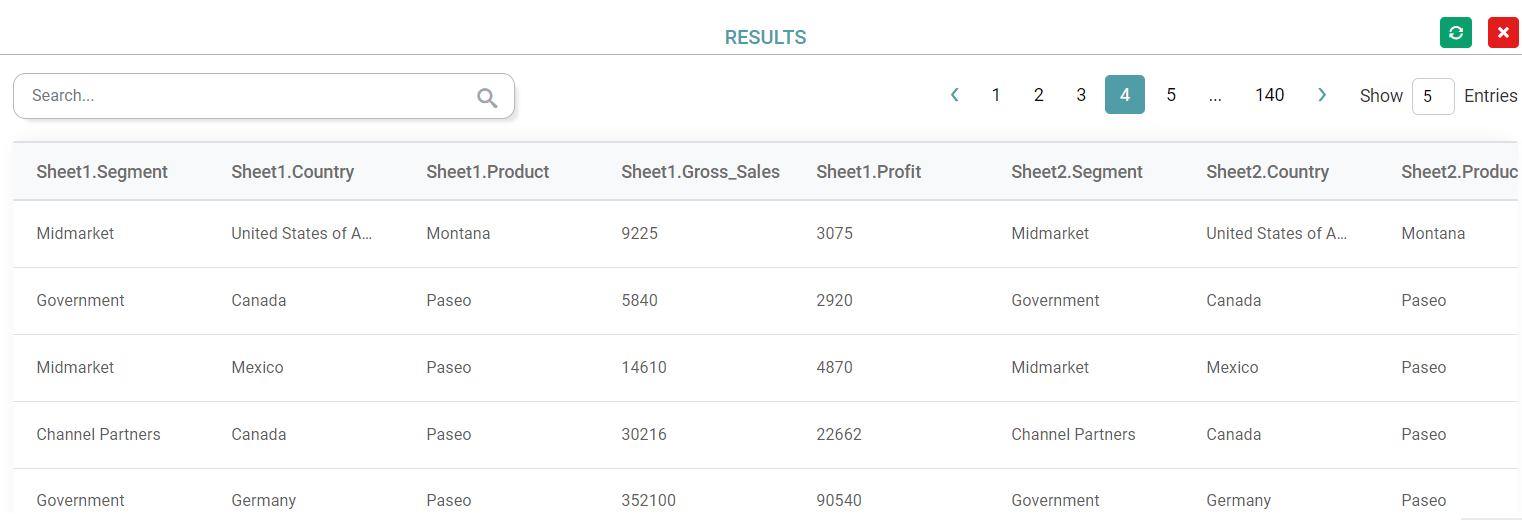
Step 6: Click on Show Preview.
Step 7: The common data in between these two tables will be shown in the Results. (Refer to the image below).
Left Join
Step 1: The user can select Left join from the join type dropdown and make the connection between two tables.
Step 2: Click on the save button.
Step 3: Click on Results and click on the settings icon.
Step 4: In the configure popup select the column name and display name according to the user requirement.
Step 5: Click on Save.
Step 6: Click on Show Preview.
Step 7: In Results, the total data in the left table will show and from the right table only common data will appear. (Refer to the image below).
Right Join
Step 1: User can select Right join in join type dropdown. And make the connection between two tables.
Step 2: Click on the save button.
Step 3: Click on Results and click on the settings icon.
Step 4: In configure popup select the column name and display name according to the user requirement.
Step 5: Click on Save.
Step 6: Click on Show Preview.
Step 7: In Results the total data which is in right table will show and from left table only common data will appear. (Refer to the image below).
Cross Join
Step 1: User can select Cross join in join type dropdown. And make the connection between two tables.
Step 2: Click on the save button.
Step 3: Click on Results and click on the settings icon.
Step 4: In configure popup select the column name and display name according to the user requirement.
Step 5: Click on Save.
Step 6: Click on Show Preview.
Step 7: This generates a paired combination of each row of the first table with each row of the second table. (Refer to the image below).
Full Outer Join
Step 1: User can select Cross join in join type dropdown. And make the connection between two tables.
Step 2: Click on the save button.
Step 3: Click on Results and click on the settings icon.
Step 4: In configure popup select column name and display name according to the user requirement.
Step 5: Click on Save.
Step 6: Click on Show Preview.
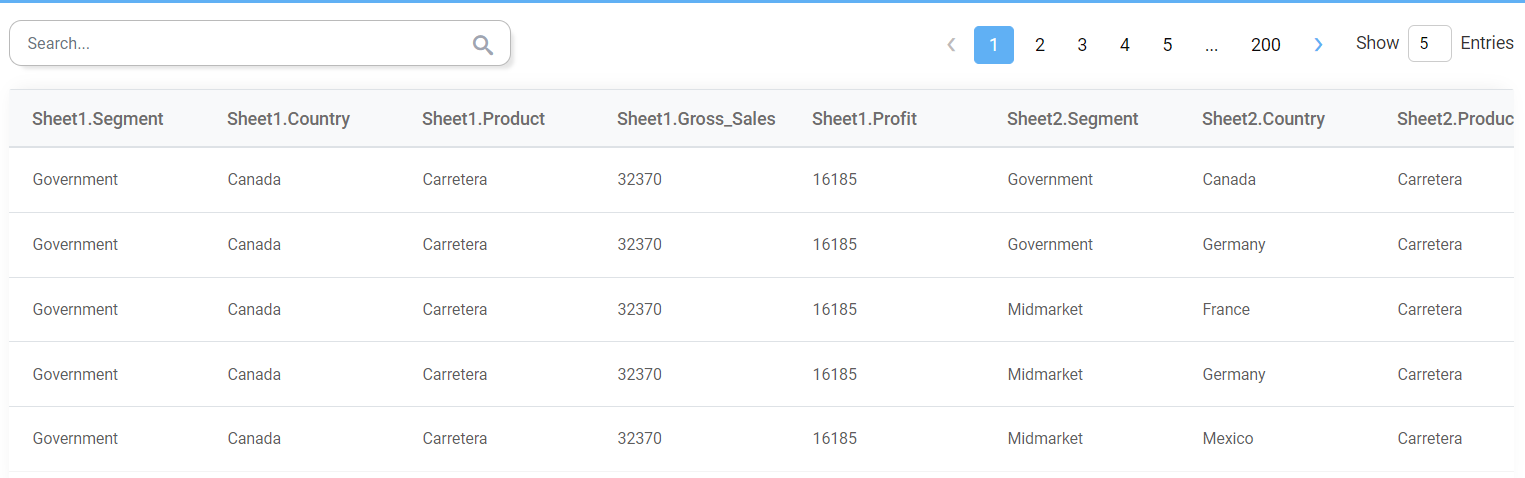
Step 7: This returns all records when there is a match in the left table (table1) or the right table (table2) records. (Refer to the image below).

Aggregate
Step 1: Click on the line and click on the settings icon. (Refer to the image below).

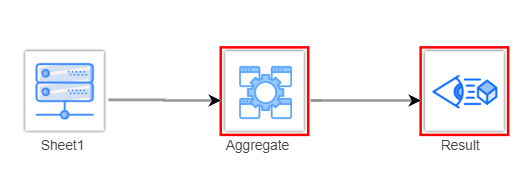
Step 2: Select Aggregate operation from the popup. Then aggregate is added in between the sheet and result. (Refer to the image below).
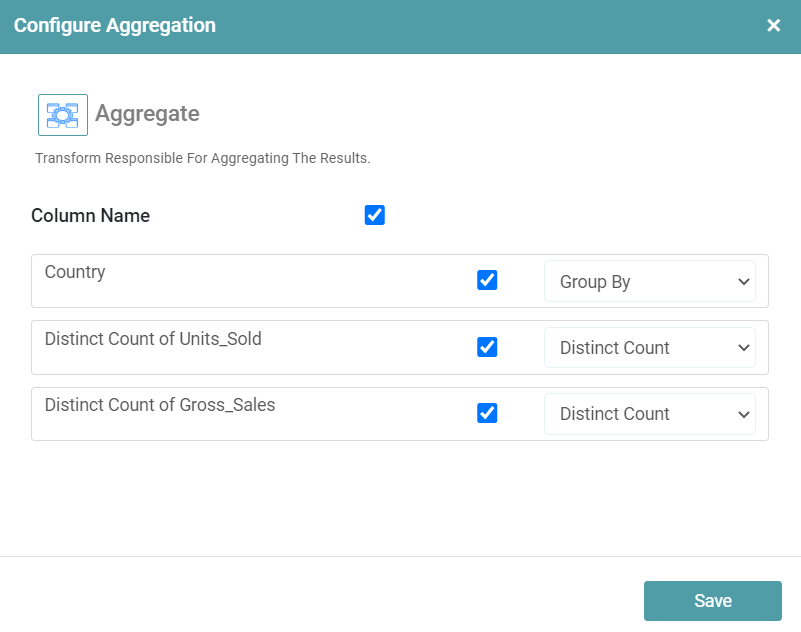
Step 3: Click on aggregate and click on the settings icon. Configure aggregate popup will appear. Select the column names and aggregate positions from the dropdown. And click on save. (Refer to the image below).
Step 4: Click on Results and click on the settings icon.
Step 5: In the configure popup select the column name and the display name according to the user requirement.
Step 6: Click on Save.
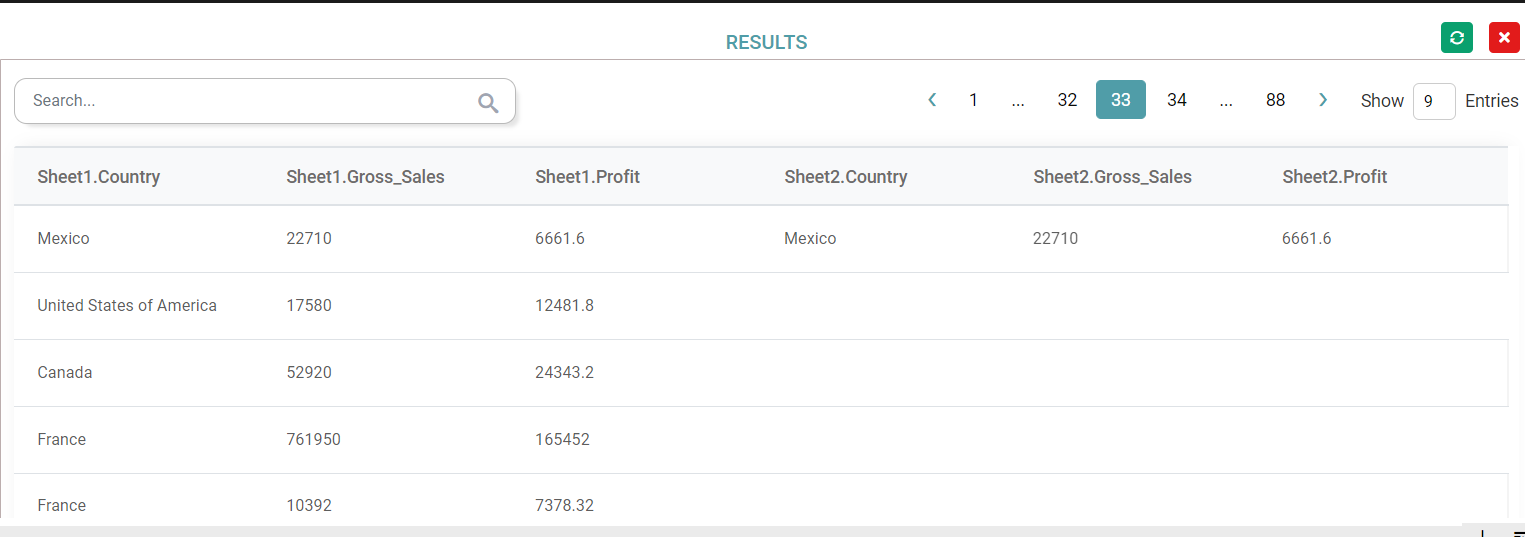
Step 7: Click on Show Preview.
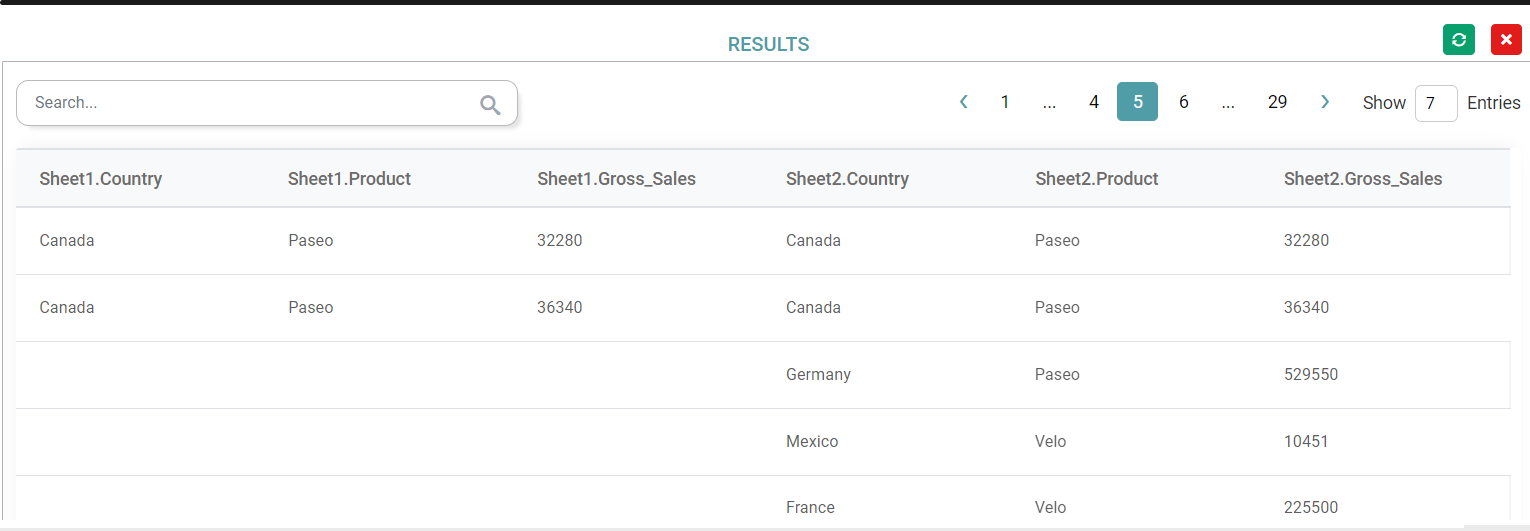
Step 8: In Results, aggregate data will appear. (Refer to the image below).
Filter
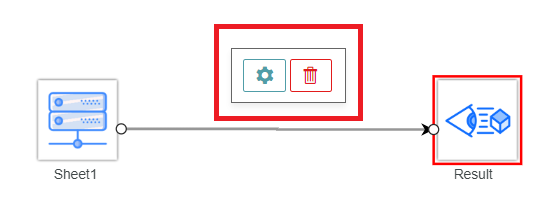
Step 1: Click on the line and click on the settings icon. (Refer to the image below).
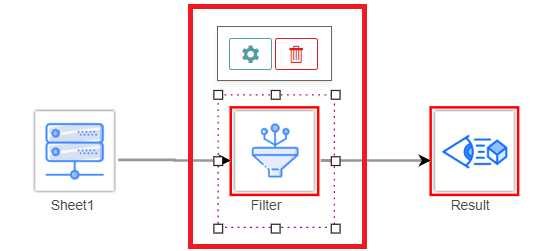
Step 2: Select Filter from the popup.
Step 3: Click on filter and click on the settings icon. (Refer to the image below).
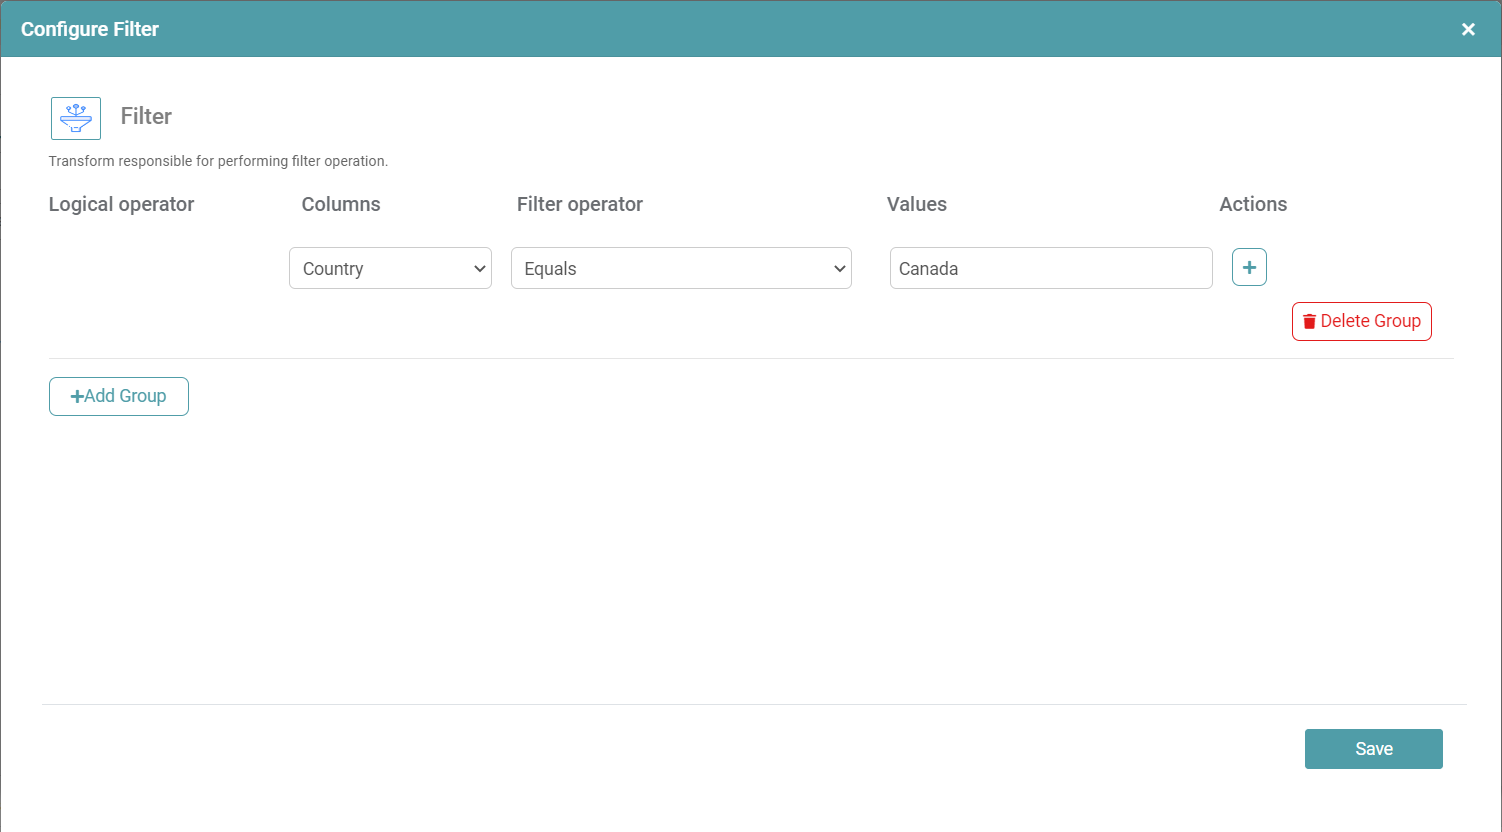
Step 4: In configure filter popup, select Logical operator, Columns, Filter operator, Values, Actions.
Step 5: Click on the Save button. (Refer to the image below).
Step 6: Click on Results and click on the settings icon.
Step 7: In configure popup select the column name and display name according to the user requirement.
Step 8: Click on Save.
Step 9: Click on Show Preview.
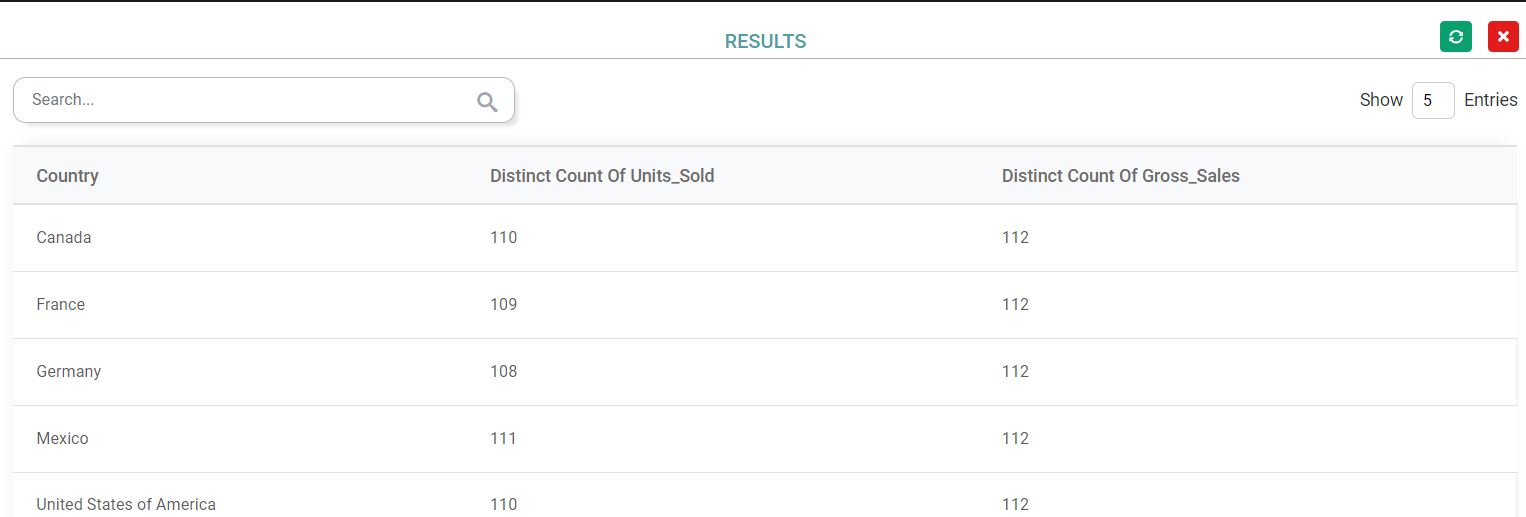
Step 10: In Results, the filtered data will appear. (Refer to the image below).
Actions
Share
Step 1: Click on the Data cube share icon in the Data cube list.
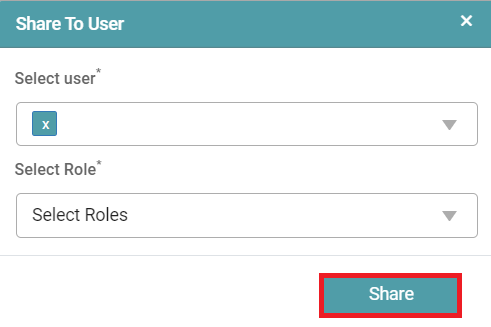
Step 2: The user will get a pop-up message. Select the user and select the role.
Step 3: Click on the share button. (Refer to the image below).
Edit
Step 1: Click on the Design Tab on the Main Navigation bar.
Step 2: Click on Add New and Click on Folder.
Step 3: Now, enter the preferred name for the Folder and click on the Data cube icon.
Step 4: A new Data cube is created.
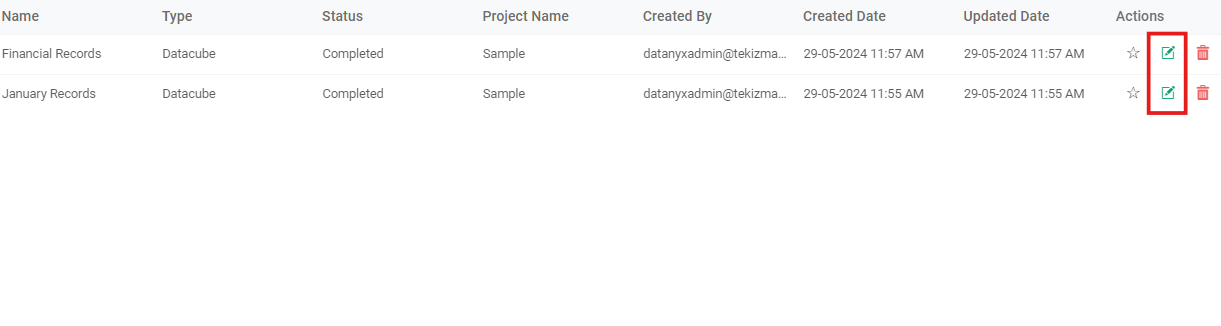
Step 5: Now, click on the Edit icon for any existing Data cube in the Data Cube list. (Refer to the image below).
Delete
Step 1: Click on the Data cube delete icon in the Data Cube list. (Refer to the image below).
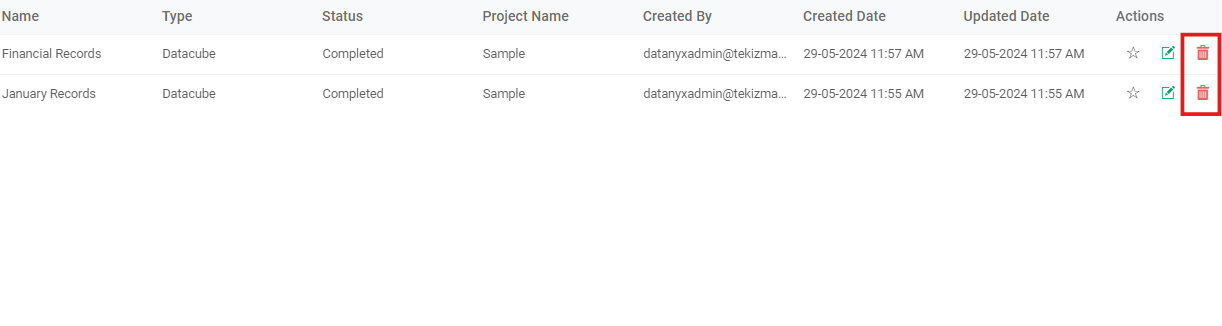
Step 2: User will get a warning message. Click on the ok button. (Refer to the image below).
Step 3: Click ok in the delete popup. The Data cube is deleted from the project list.
Security Tags
Step 1: Select the Datasource from the dropdown.
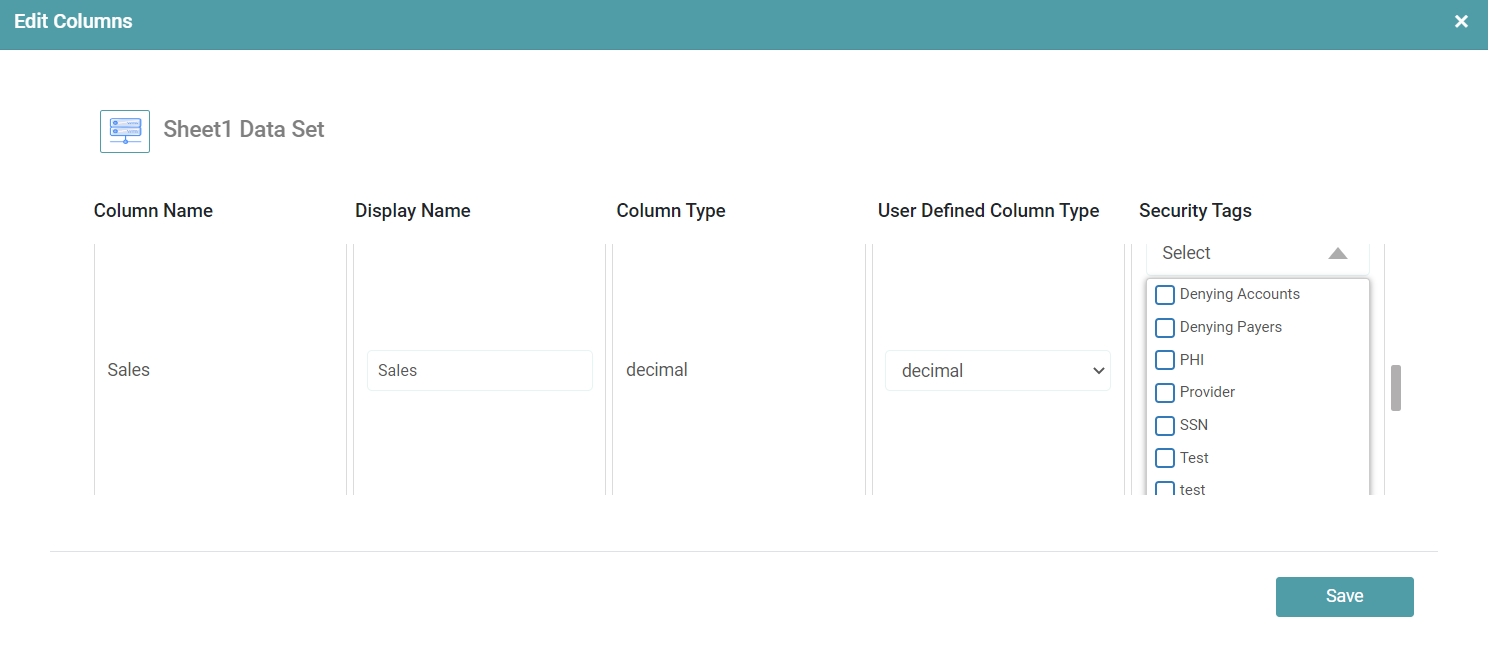
Step 2: Double click on the dataset. The Edit columns popup appears. (Refer to the image below).
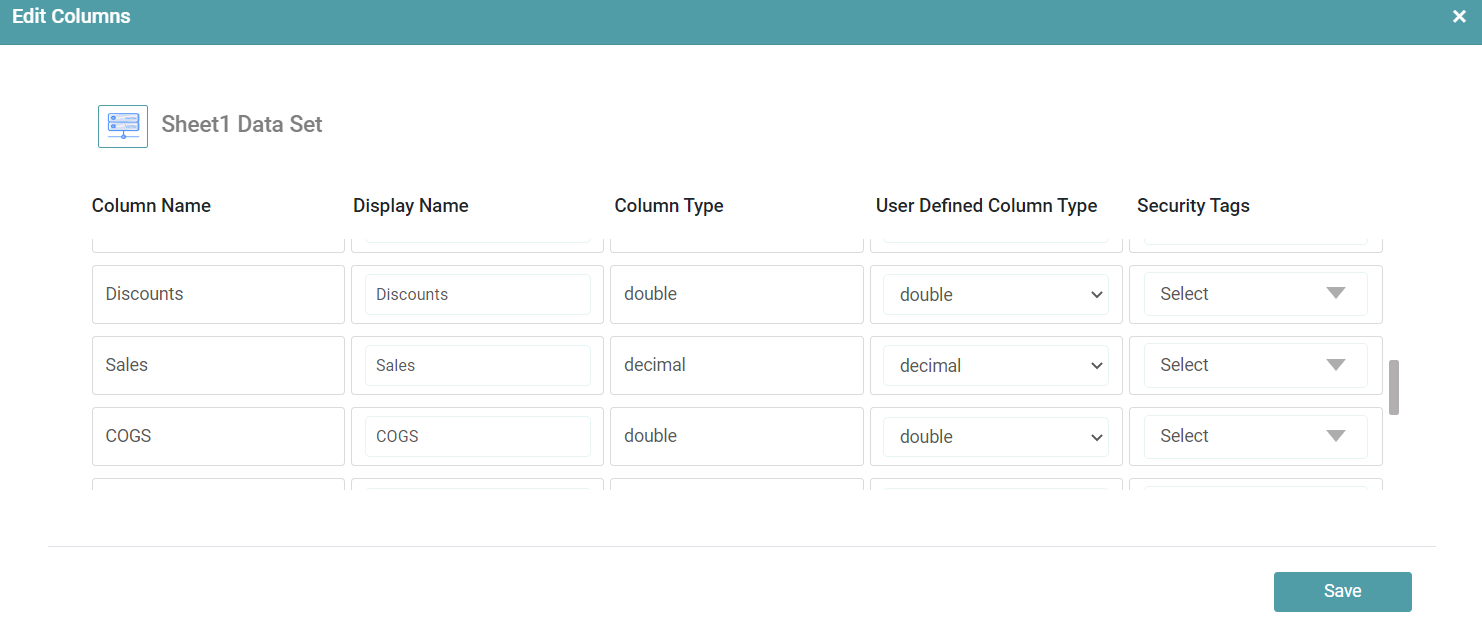
Step 3: Select user defined column type and security tags from the respective dropdowns.
Step 4: Click on save. The saved security tags will be added to those dataset columns. (Refer to the image below).