Creating a Filter
Step 1: On the Main Navigation tool bar click on design.
Step 2: Click on Add New button. Click on Folder to create a new folder.
Step 3: Enter the name of the Folder and choose filter option to start your design.
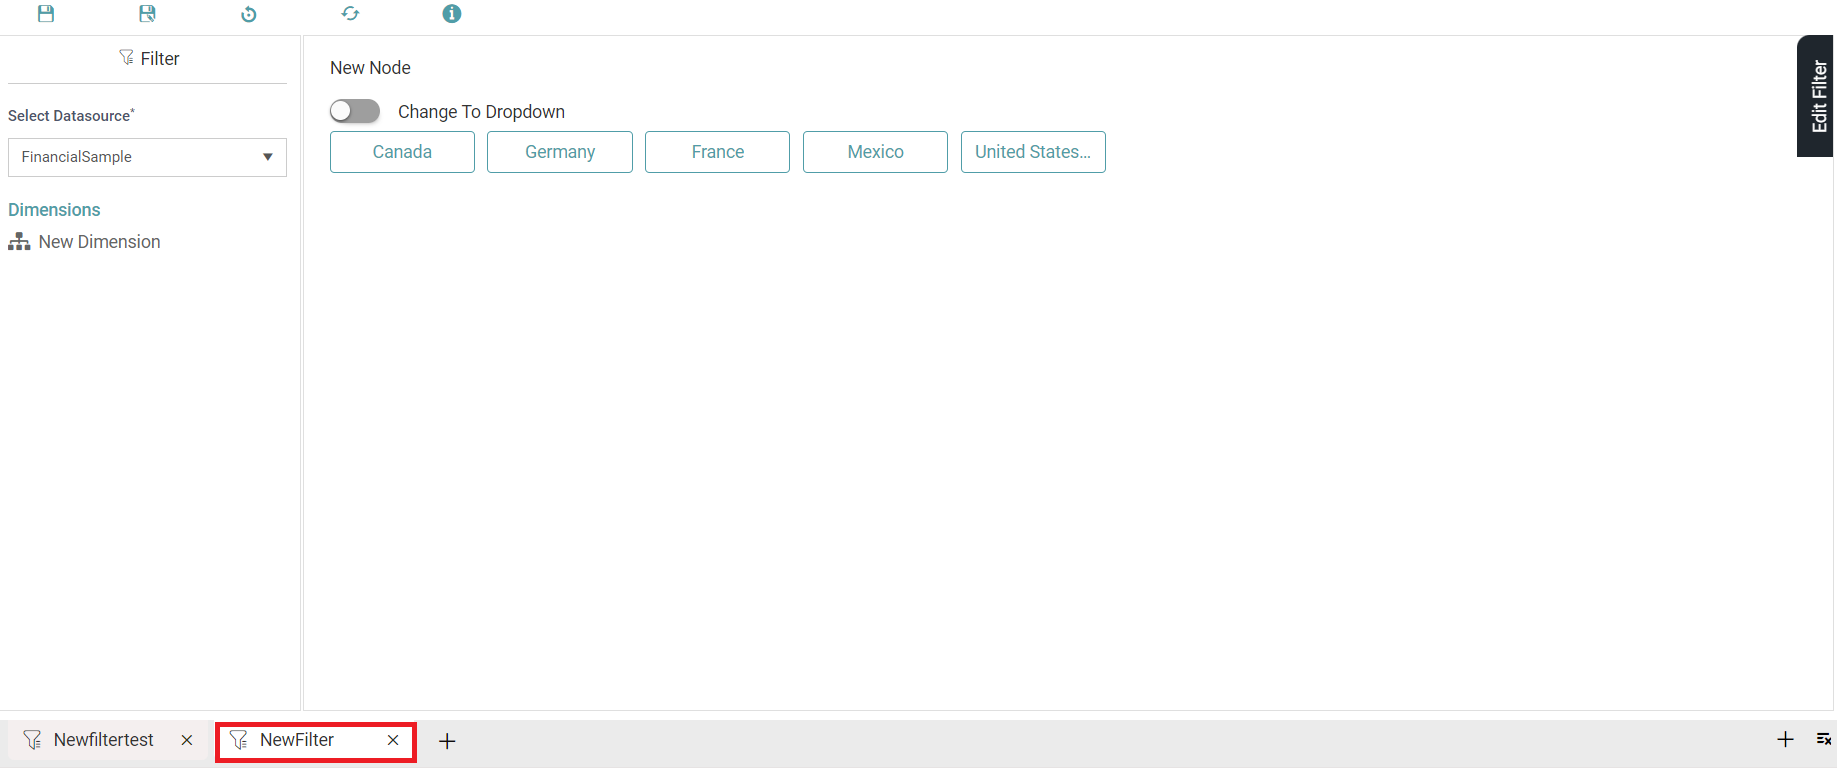
Step 4: Select the Data Source. Now, drag and drop the dimensions onto the main screen. (Refer to the image below).
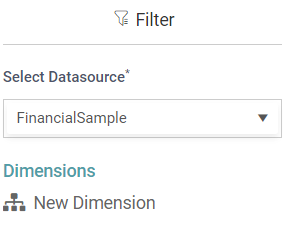
Step 5: The dimension will be converted into filter.
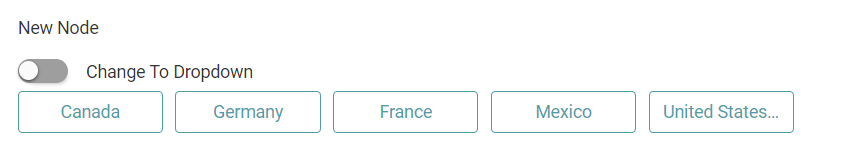
Step 6: You can change it to button or dropdown type by enabling/ disabling the toggle. (Refer to the image below).


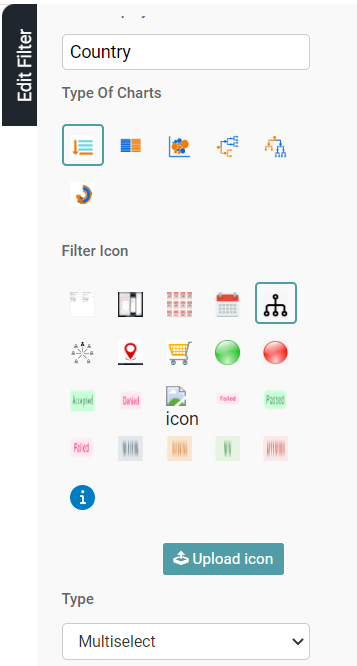
Step 7: Click on the Edit filter icon. (Refer to the image below).

Step 8: Enter the name of the filter and select the type of charts and filter icon. (Refer to the image below).
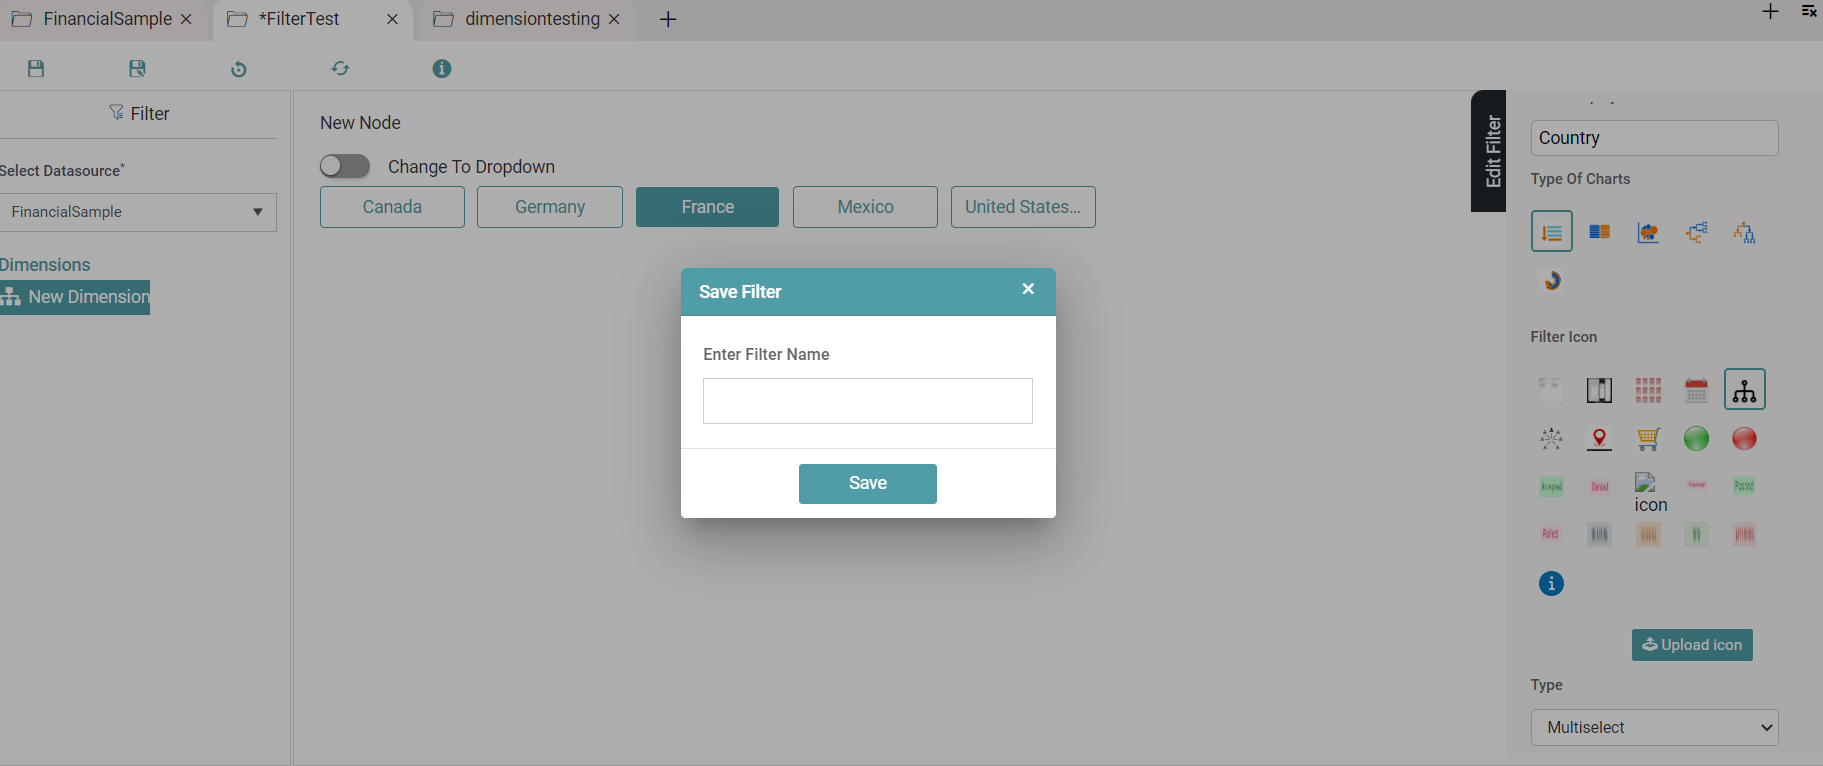
Step 9: Click on the save icon. Enter the name and click on the save button. (Refer to the image below).
Step 10: Save filter popup appears. Click the ok button. (Refer to the image below).
Step 11: Filter is saved and listed in reports list.
Multiselect – Filter
Step 1: Click on the Edit filter icon. (Refer to the image below).

Step 2: Enter the name of the filter and select the type of charts and filter icon.
Step 3: In filter type, select Multiselect.
Step 4: Save the filter. (Refer to the image below).

Step 5: Apply the filter in a report. Save the report and publish it.
Step 6: Go to the dashboard. The multiselect option will be applied to the report.
Save
Step 1: Create a Filter.
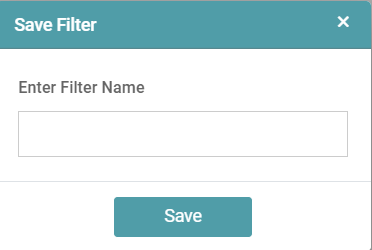
Step 2: Click on the save icon. The save filter popup appears. Enter the name of the filter and click on Save. (Refer to the image below).

Step 3: The Filter is saved successfully. Click the OK button. (Refer to the image below).

Save As
Step 1: Create a filter or select an existing filter.
Step 2: Click on save as icon. The save filter popup appears. Enter the name for filter and click on save button. (Refer to the image below).
Step 3: The Filter is saved successfully. Click the OK button. (Refer to the image below).
Step 4: Then the filter is saved with the given name. (Refer to the image below).
Reset
Step 1: Create a filter or select an existing filter.
Step 2: Click on the reset icon.
Step 3: A warning message will pop up. Click the OK button. (Refer to the image below).
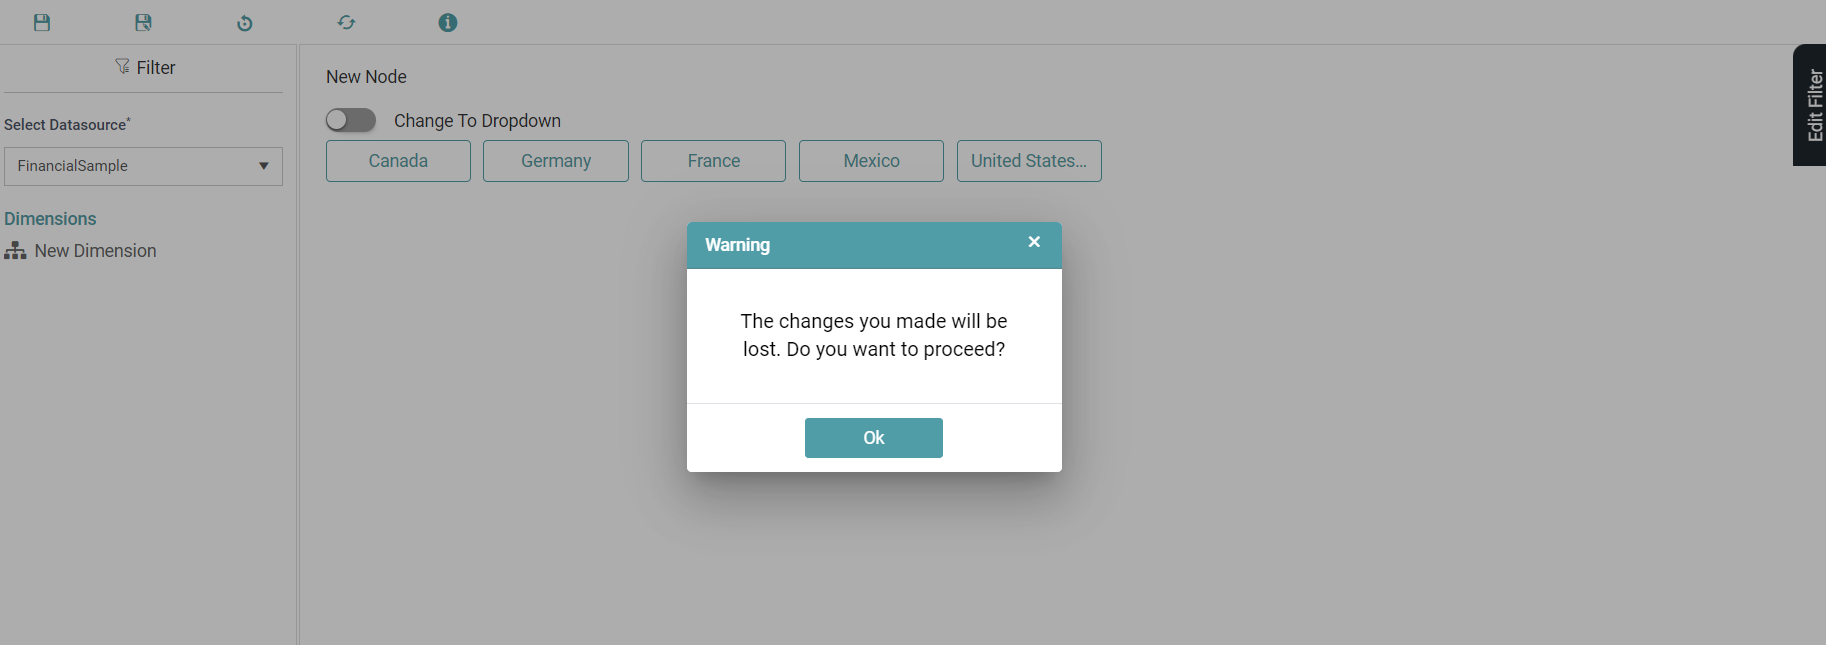
Step 4: Then all the changes will be lost.
Refresh
Step 1: Create a filter or select an existing dimension.
Step 2: Click on the refresh icon.
Step 3: Changes made are updated or screen will be refreshed.
Help
Step 1: Click on the help icon.
Step 2: It will take to Datanyx online help page.
Edit
Step 1: Click on the Design Tab on the Main Navigation tool bar.
Step 2: Click on the add icon on the bottom right of the screen.
Step 3: Reports/charts/dimension/filter list will come, click on open existing and click on Filter. Now, click on the edit icon for the required filter.
(Refer to the image below).

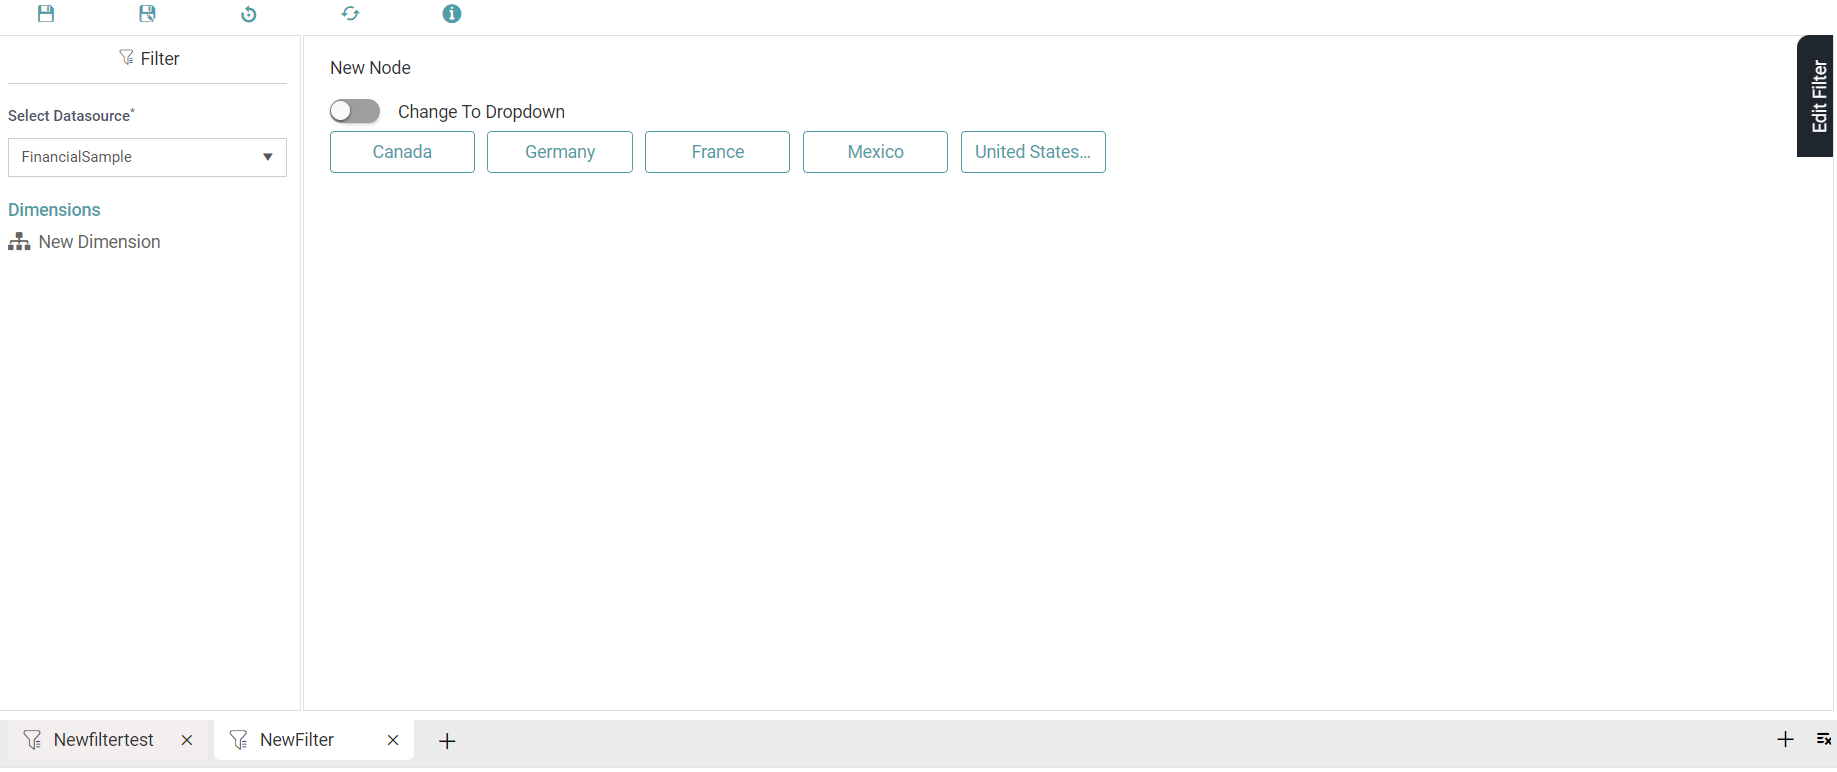
Step 4: Then you will be taken to that filter. (Refer to the image below).
Delete
Step 1: Click on the Design Tab on the Main Navigation tool bar.
Step 2: Click on the add icon on the bottom right of the screen.
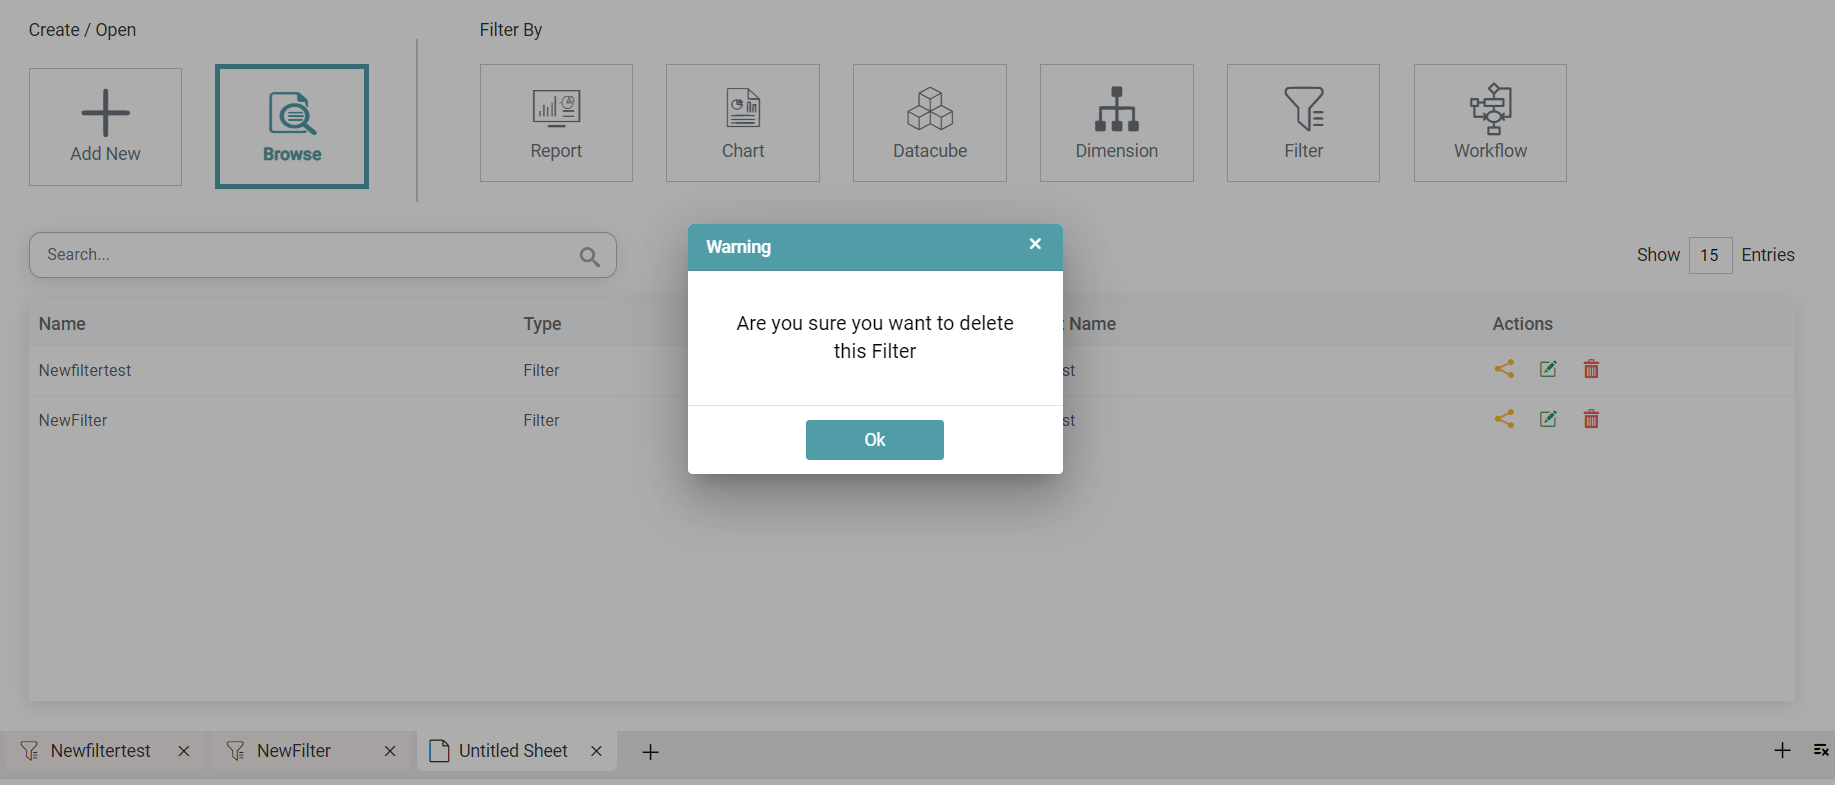
Step 3: Reports/charts/dimension/filter list will come, click on open existing and click on Filter. Now, click on the Delete icon for the required filter.
Step 4: A warning message popup will appear. Click the OK button. (Refer to the image below).
Step 5: The filter is successfully deleted. Click OK. (Refer to the image below).
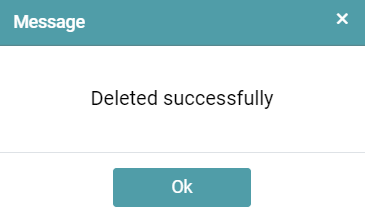
Step 6: The filter is deleted from the list.