Descriptive Statistics – Introduction
This node helps the user get the descriptive statistics of the columns in a table.
Step 1: Once data is imported, click on the statistics tab.
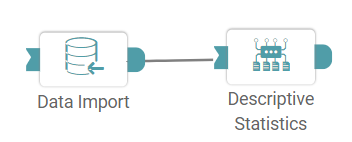
Step 2: Drag and drop the descriptive statistics node onto the main screen. Connect the two nodes. (Refer to the image below).


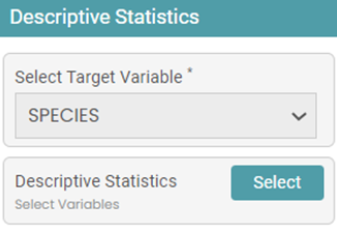
Step 3: Once this has been done, select the target variable of the dataset. Then select the variables that you want to get the descriptive statistics for. (Refer to the images below).
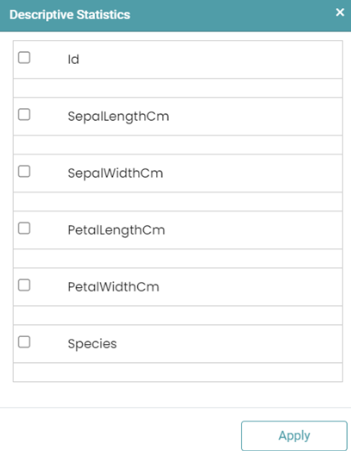
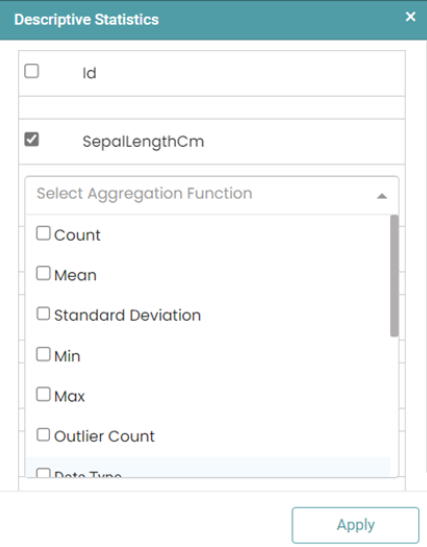
Step 4: Check the variables that you require, and you’ll get a drop down listing the descriptive statistics that you need. Those will include:
- Mean
- Count
- Standard Deviation
- Kurtosis
- Skewness
- 25th Percentile
- 50th Percentile
- 75th Percentile
- Minimum
- Maximum
- Data Type
- Negative Value count
- Null Value Count
- Outlier Count
(Refer to the image below).
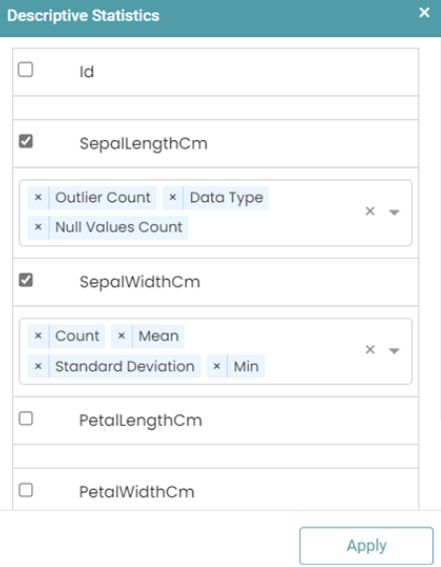
Step 5: Click on the required descriptive statistics for each of the selected columns and click Apply. (Refer to the image below).
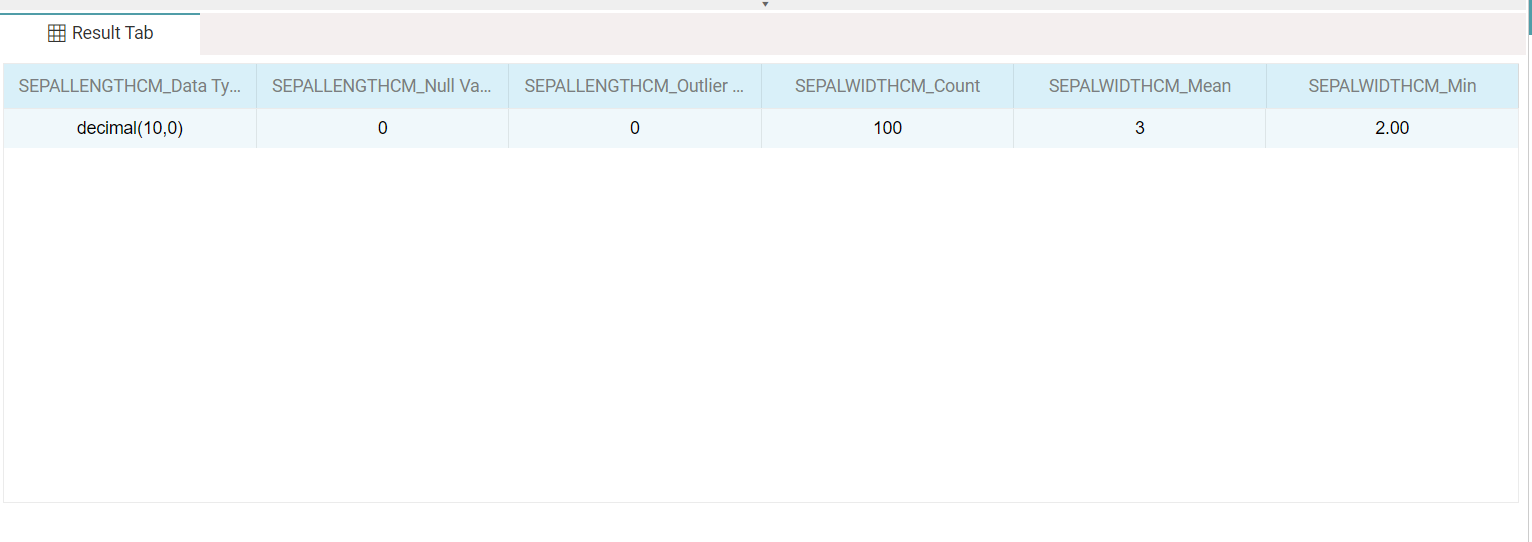
Step 6: Click the run button. The result will be displayed under the result tab in the form of a table. (Refer to the image below).
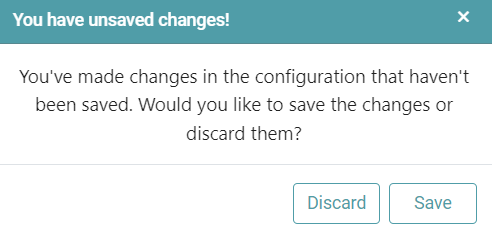
Note: After configuring a node, ensure you click “Save” to retain the changes. If you need to undo the configuration, click “Discard.” Failing to choose either “Save” or “Discard” will trigger a warning pop-up. (Refer to the image below).