Main Home Page
The Home Page is the main page of the site. The Datanyx interface uses simple toolbars, tabs, set-up panels and a main window to provide you with all the reports and data analysis you need in real time. The Home Page has many features, and you can follow the instructions to utilize them. There are 2 general areas of interest in the Datanyx web-based application as shown in the figure below.
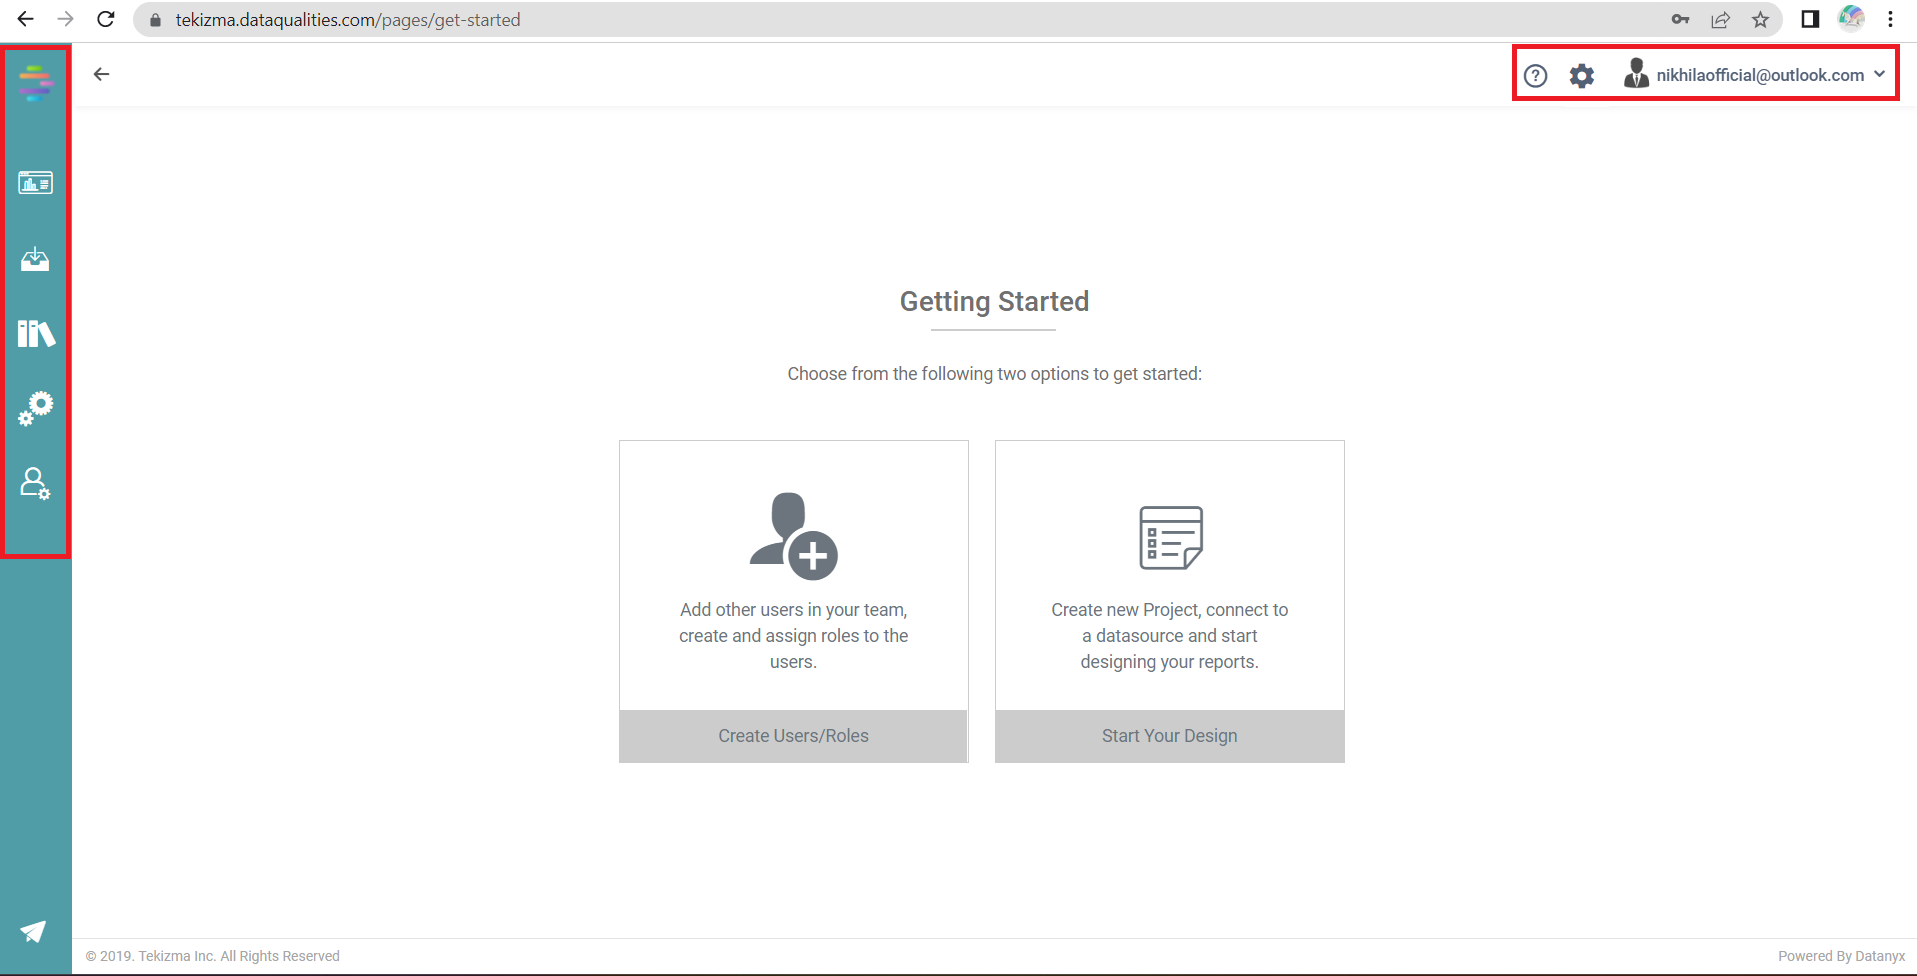


Navigation Bar
Use the Main Navigation Bar to view and navigate to various pages of the application. The navigation bar will be hidden, and it opens when we hover on it.
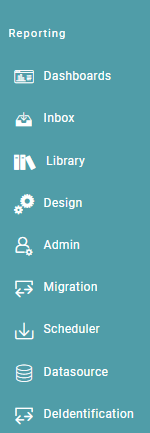
Dashboards
The dashboard is a data visualization tool that displays on a single screen the status of business analytics metrics, key performance indicators (KPIs) and important data points for an organization, department, team or process.
Inbox
The Inbox receives updates when any user creates a report.
Library
All the reports and dashboards are stored in the library.
Design
Various design elements can be used to create appealing dashboards befitting the requirement and need of the organization.
Admin
The admin option is used to create users and assign roles.
Migration
The user can download the Report(s), Custom Script(s), Data Model(s) and Workflow(s) as a Datanyx file.
Scheduler
The scheduler efficiently organizes and automates the timing of report generation.
Datasource
Users can add or connect to new data sources or modify existing ones using Datasource Management and Connector management.
Deidentification
De-identification ensures data privacy by removing or masking sensitive information while retaining its utility for analysis.
User Menu
The User Menu is at the top right corner of the main page. Use the User menu for various functions such as Online BI tool help, Choose Skins, My Account, Change Organization and Logout.
BI Online Help
The help option contains the user manual for the BI tool. We can refer to the document for understanding the functionality and to know the steps to perform any action.
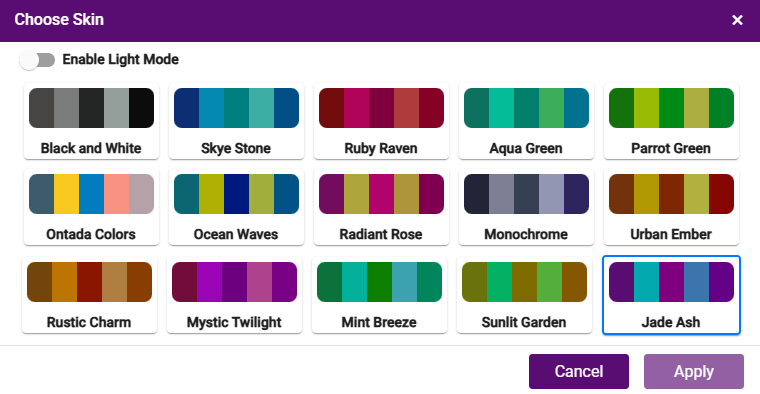
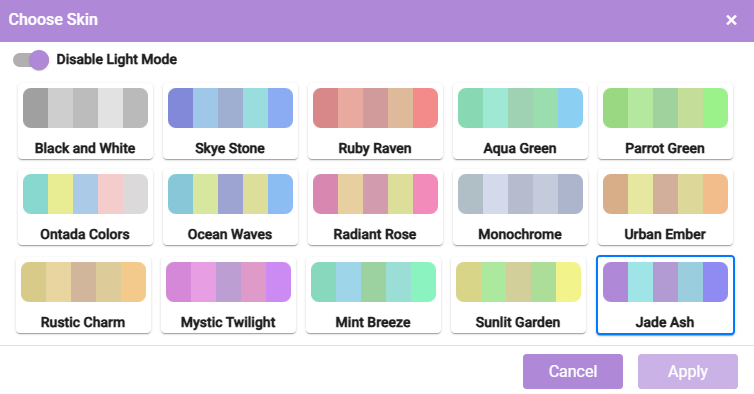
Skin
The Theme option provides various theme styles for you to choose from. Select the desired theme from the list based on your preferences. Once you choose a theme, the entire application will adapt its appearance to match the selected theme.
Themes
The entire application will adapt its appearance to match the selected theme.
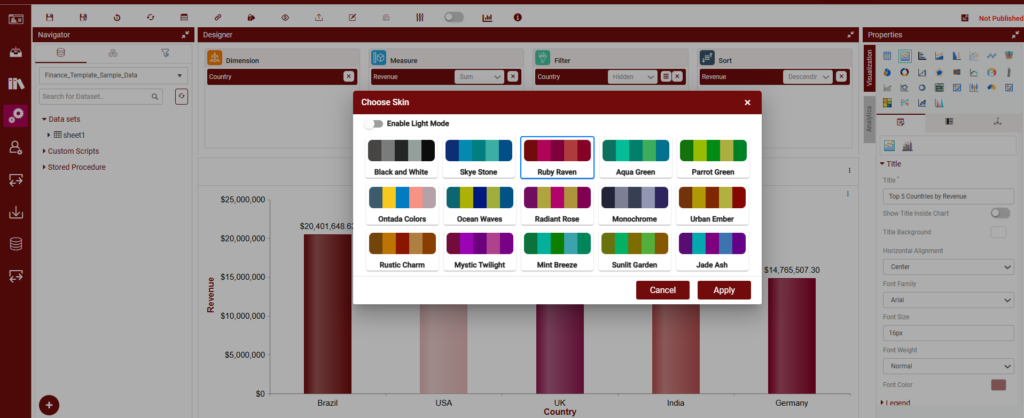
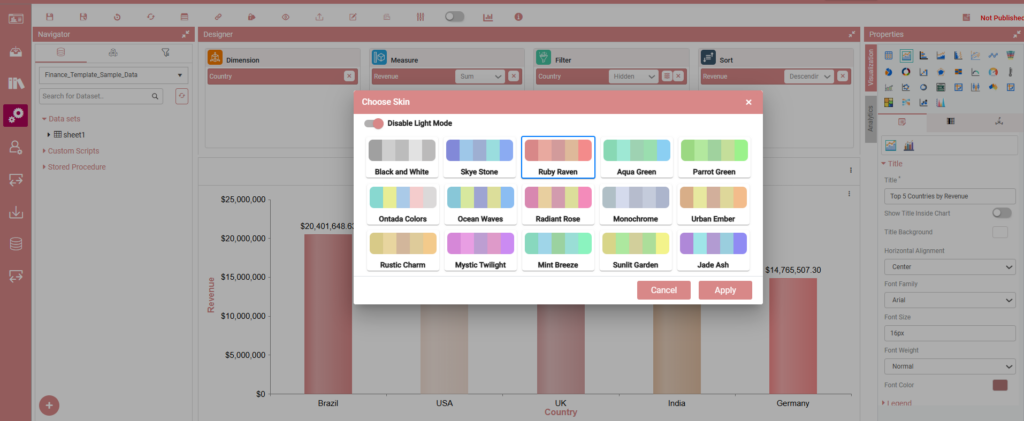
Step 1: Click on the “⚙ “settings icon at the top right corner of your screen to select the “Theme”. You can toggle between dark mode and light mode. (Refer to the images below).
Step 2: In the chart designer, the color picker is assigned to the theme selected. The user can change the color regardless of the theme selected by clicking on table properties and header color. Users can also toggle between Dark and Light mode. (Refer to the images below).
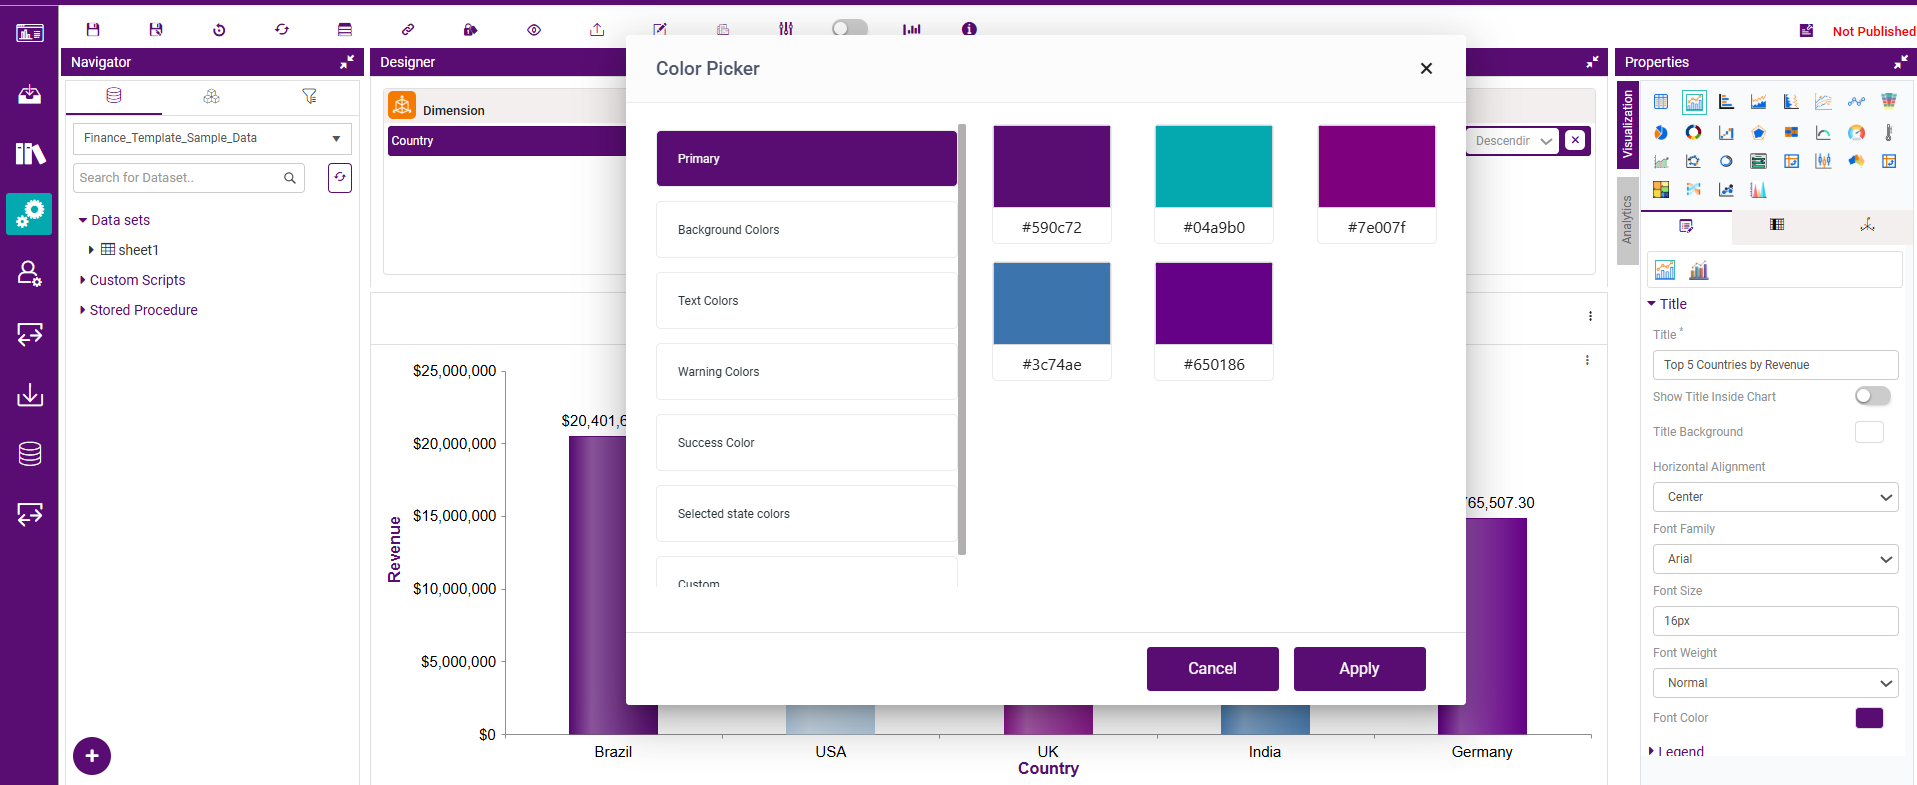

Step 3: When a different theme is picked, the color selected in the color picker changes to the profile theme color. (Refer to the images below).
Step 4: The Theme is applied to all color changeable functions.
Account
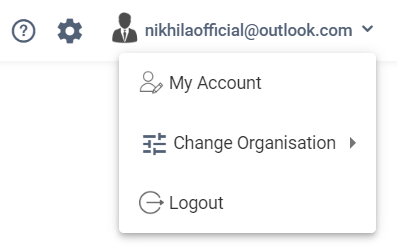
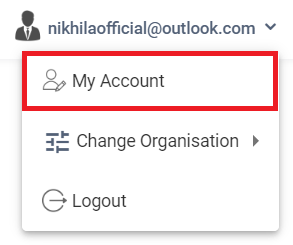
The Account dropdown contains 3 options:
- My Account
- Change organization
- Logout
My Account
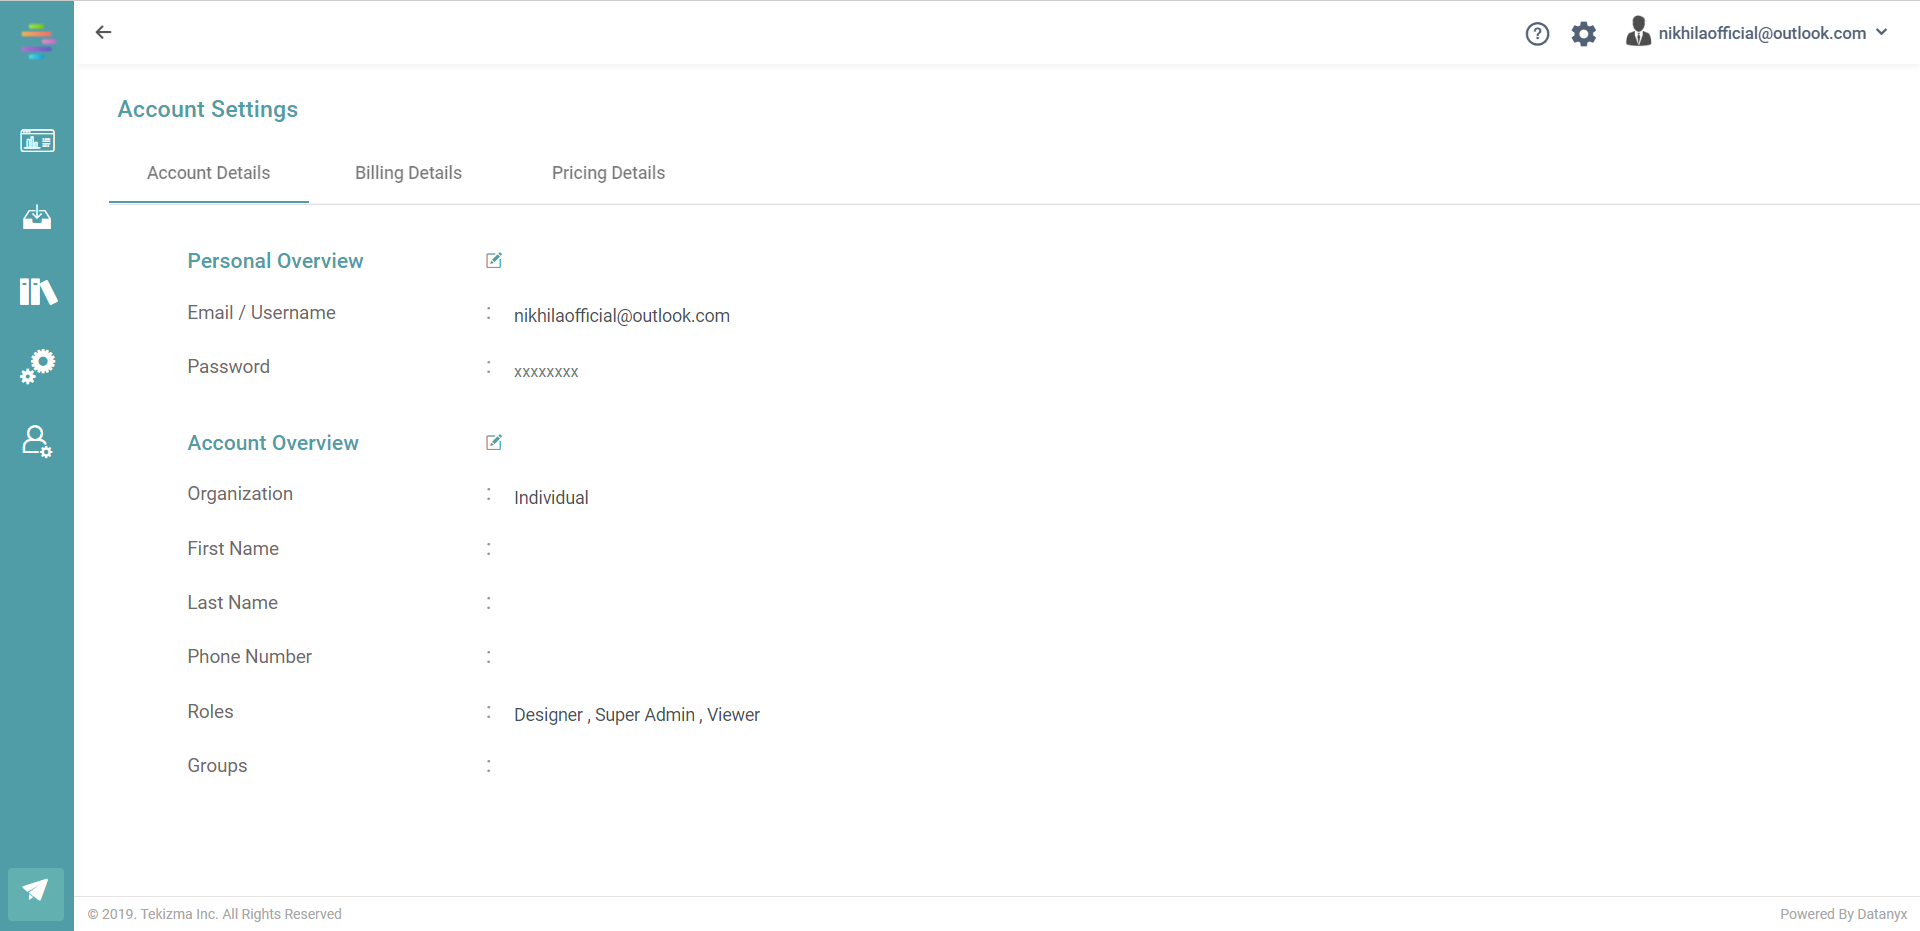
This option contains the user account details, billing details and pricing details of the user that has signed in. We can check the mentioned details under different tabs on the account page.
Step 1: Click on “Username” and Click “My Account”. You will be directed to the “Account Settings” page. (Refer to the image below).
Step 2: In the “Account Settings” page there would be 3 Sub menus available. “Account Details”, “Billing Details” & “Pricing Details”.
Step 3: Under “Account Details”, the User can Edit/Fill their Official Details and save it.
Step 4: The following fields that are present in the Account Details section can be filled – Email/Username, Password, Company Name, First Name, Last Name, Phone Number, Address, Pin code. (Refer to the image below).
Change Organization
You can change the organization if there is more than one.
Logout
The Logout option will let you sign out from the application.