My Charts
Step 1: On the main navigation bar, click on Library.
Step 2: The library has three sections to choose from. They are –
- Reports
- Charts
- Workflow
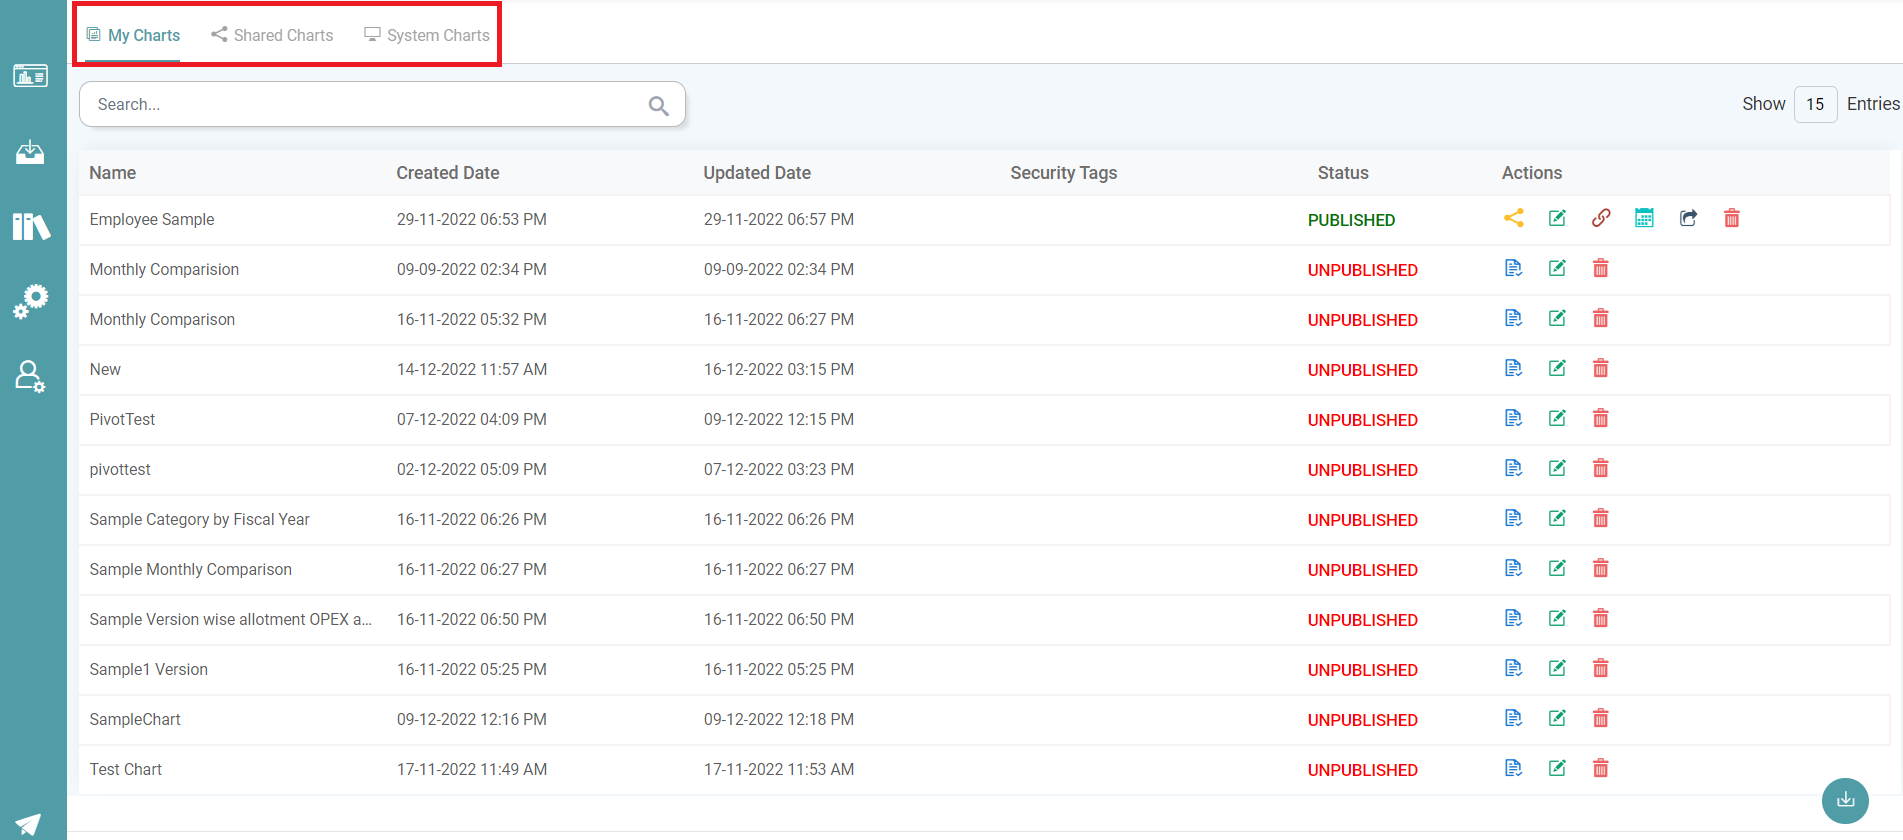
Step 3: The various tags included under Charts are:
- My charts
- Shared Charts
- System Charts


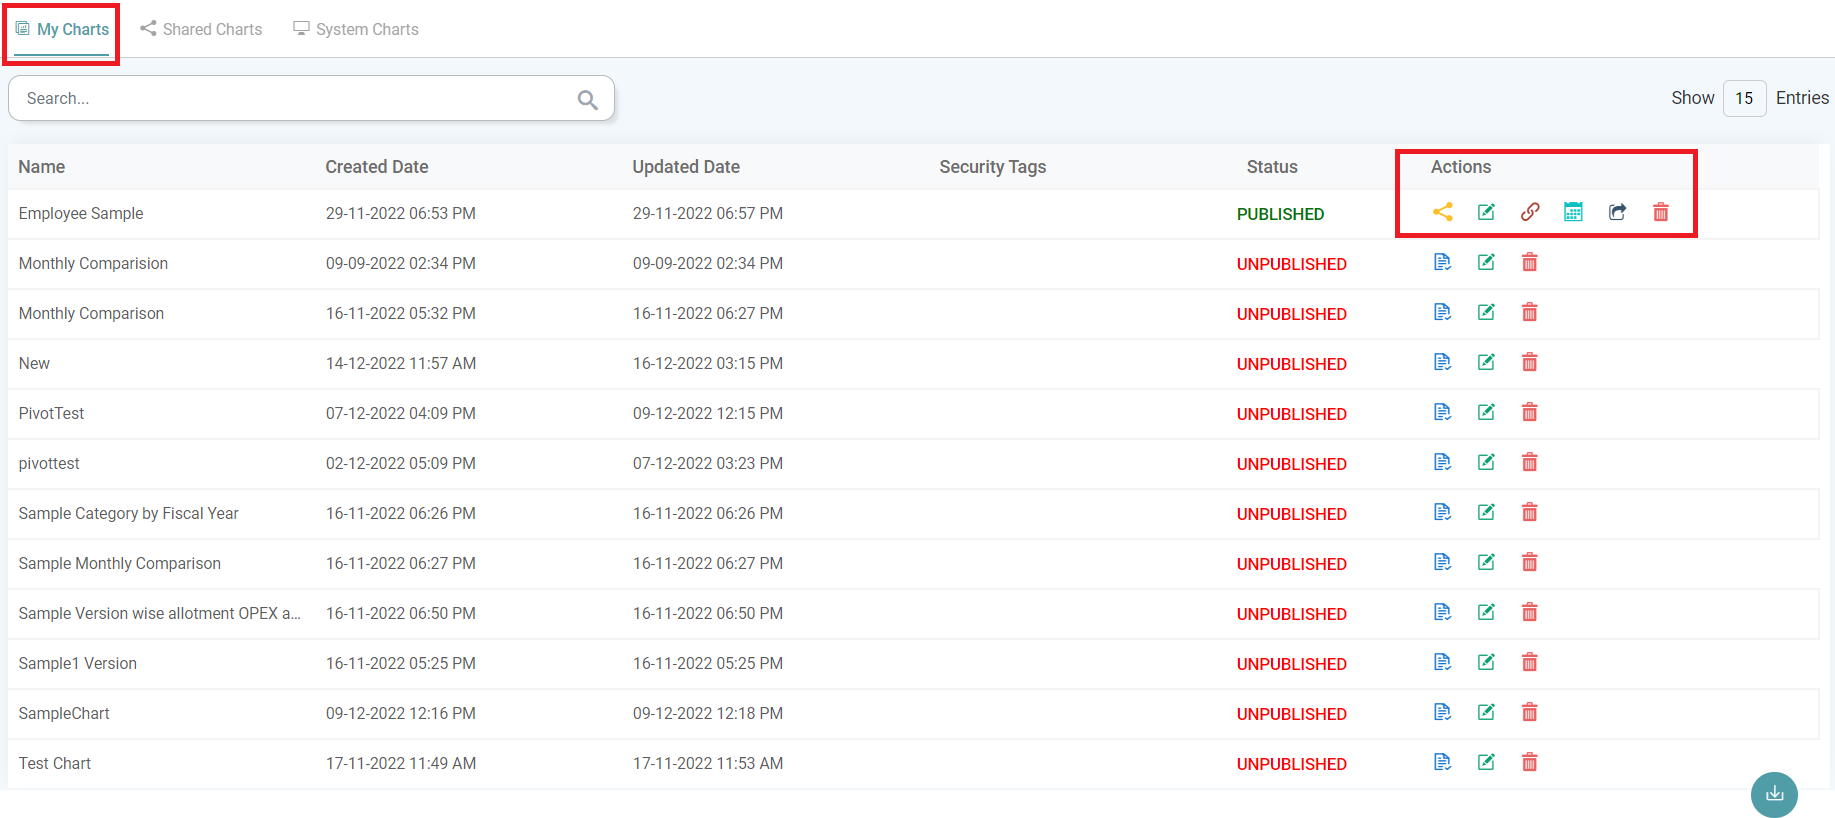
Actions under My Charts and Shared Charts are the same. Note: The Action items stated below will be visible once the user Publishes the chart.
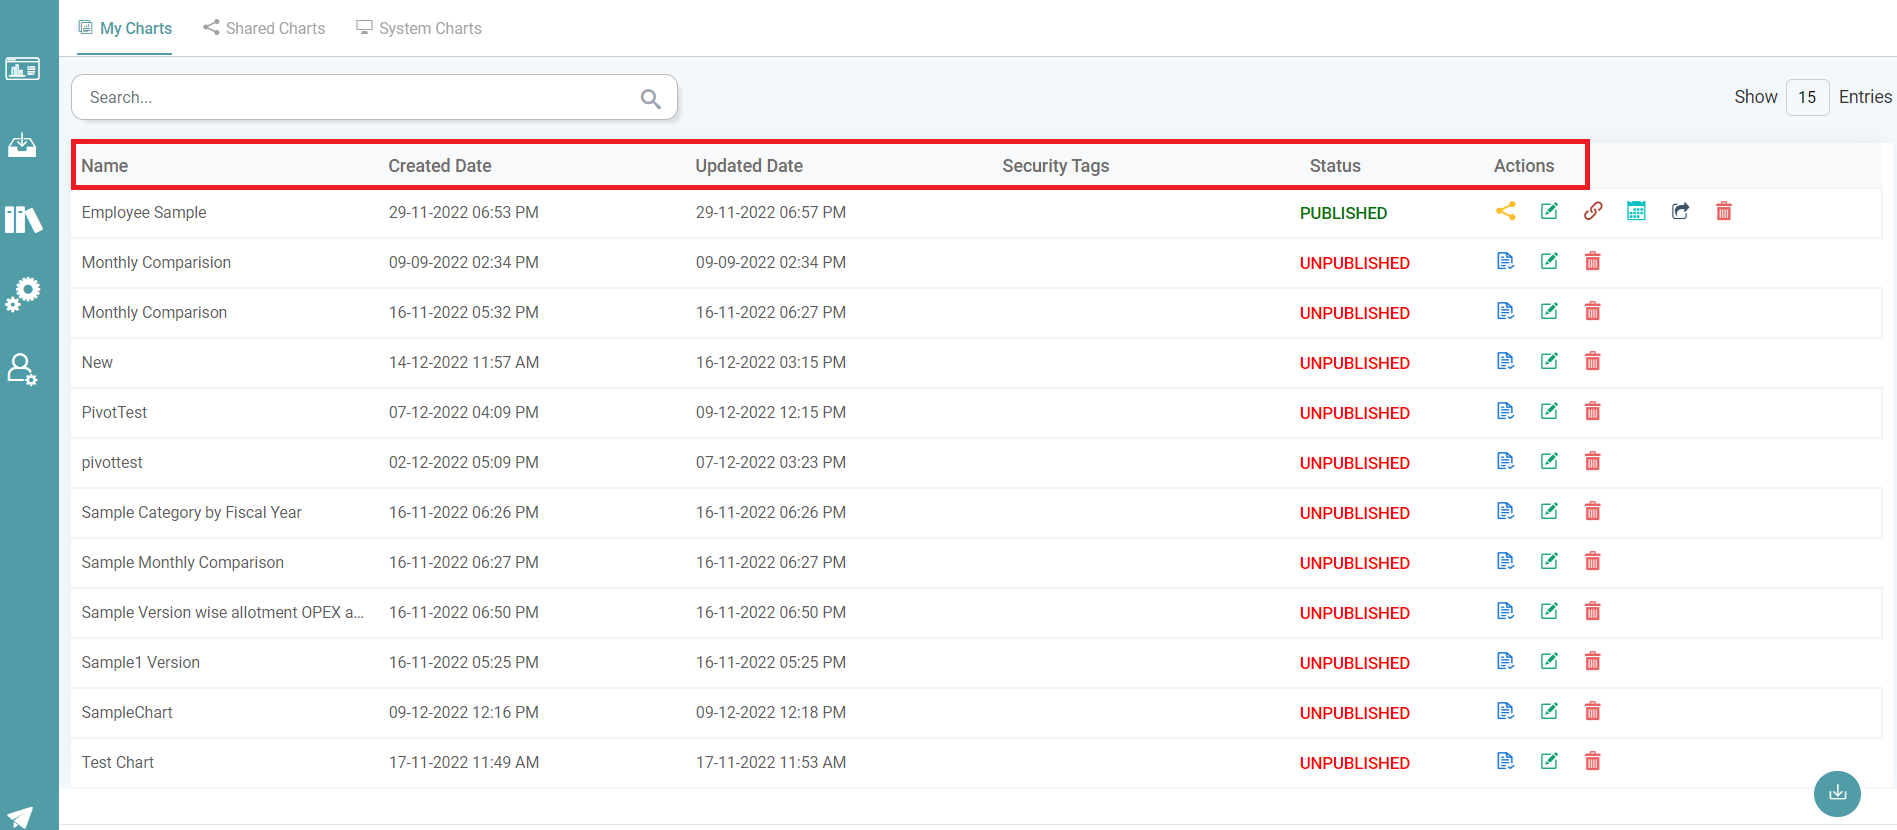
This section of the library contains the following:
- Name
- Created Date
- Updated Date
- Security Tags
- Status
- Actions
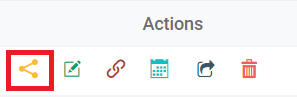
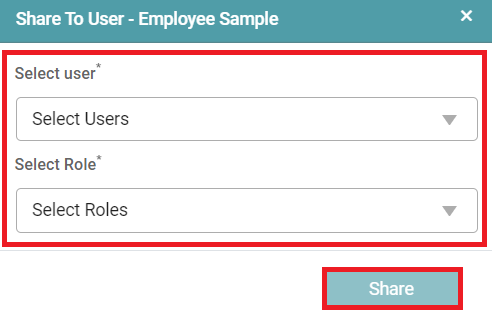
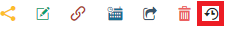
Share
Step 1: The share button helps in sharing the charts that have been created with different users based on their roles. (Refer to the image below).
Step 2: Here, one needs to select the user with whom the charts ought to be shared. Further, the role of the user needs to be selected.
Step 3: The user can then click on the share button such that the charts can be shared with the users that have been selected. (Refer to the image below).
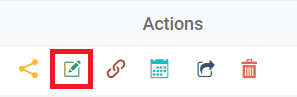
Edit
The edit button helps in making changes in the existing reports created. (Refer to the image below).
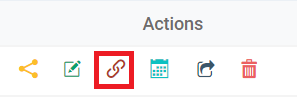
Embed Link
The embed link creates the URL link for the report that has been generated. Click on the “embed” link icon under actions. A pop-up screen appears. (Refer to the images below).
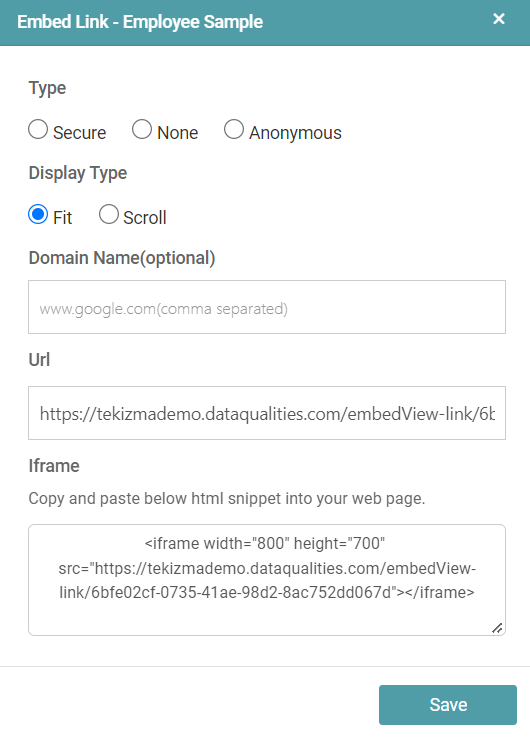
The options available to the users are as follows:
- Type
- Display type
- Domain name (which is optional)
- URL
- iframe
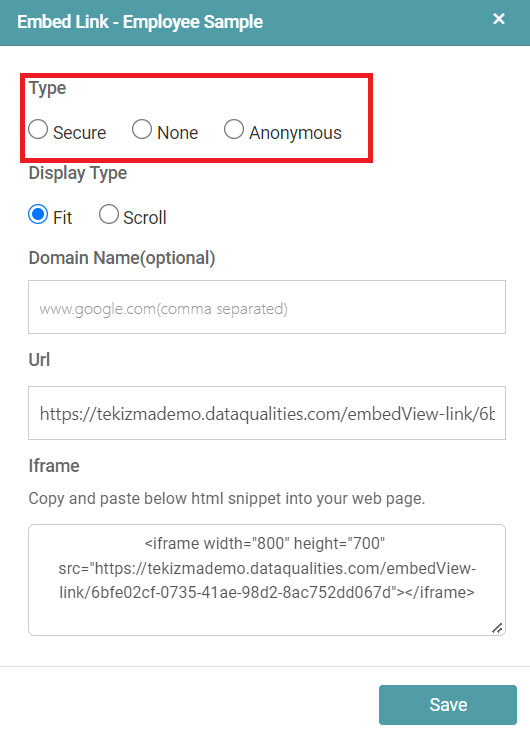
Type
Under type, the users can choose between the following radio buttons:
Secure
The user is able to protect the URL and the said URL cannot be viewed anonymously.
None
The user can share this with anyone, and no username or password is required to open such charts.
Anonymous
The user is able to share this type of report with anyone. There is no requirement of username or password to open such charts. (Refer to the image below).
Display Type
Under display type, the users can choose between “Fit” or “Scroll”.
Fit
When the user chooses this option, the contents are generated in a single page.
Scroll
The scroll option generates the report such that the user has to scroll down to view the contents of the chart. (Refer to the image below).

Domain Name
The user can select the domain name. The selection of the same is optional. (Refer to the image below).

URL
Step 1: A URL will be available to the user under the URL option.
Step 2: The users can Share/ Copy/ Paste the URL in a new window.
Step 3: The person with the URL is able to generate and view the report. “None” and “Anonymous” types does not require login credentials to view the chart. (Refer to the image below).

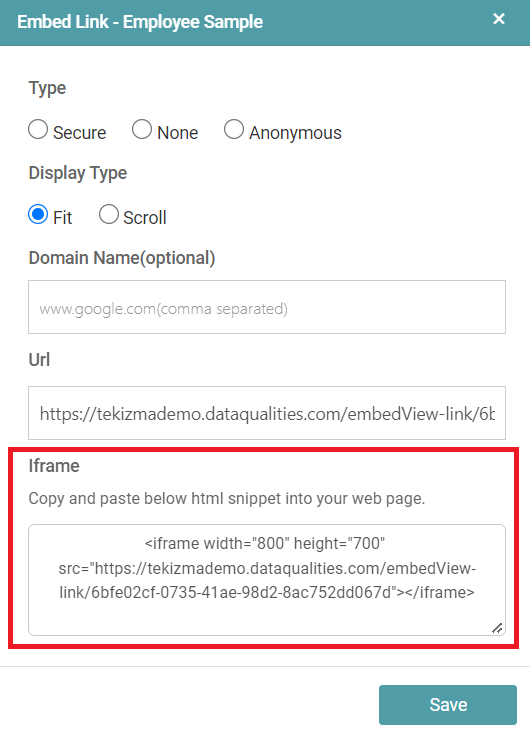
Iframe
Lastly, iframe is the HTML code for the report. If the user copies the link and pastes it in the design report HTML tab, the chart will be visible. (Refer to the image below).
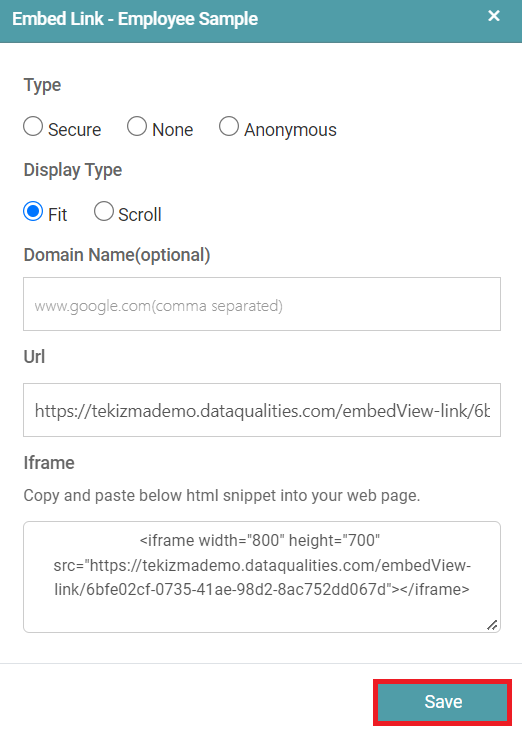
Finally, the user can click on the “save” button. The options that were previously selected by the user will also be saved. (Refer to the image below).
Schedule
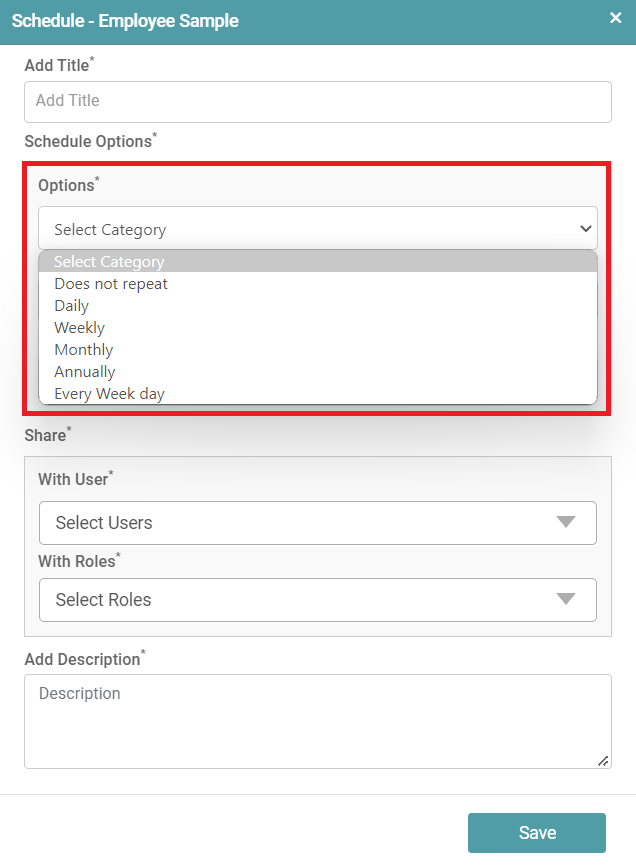
Step 1: The schedule button aids in the sharing of the chart based upon the schedule fixed.
Step 2: A ‘Schedule’ pop-up appears once the user clicks on the schedule icon. (Refer to the images below).

Step 3: The chart created by the user can be scheduled for display for different users.
Step 4: Now, the user is able to add title and schedule options. The user needs to select category of display i.e., how the schedule is categorized. (Refer to the image below).
Step 5: Post this, the user has an option of scheduling the display of the report with the users he wants to share it with. He can also choose the individual roles of the user. (Refer to the image below).
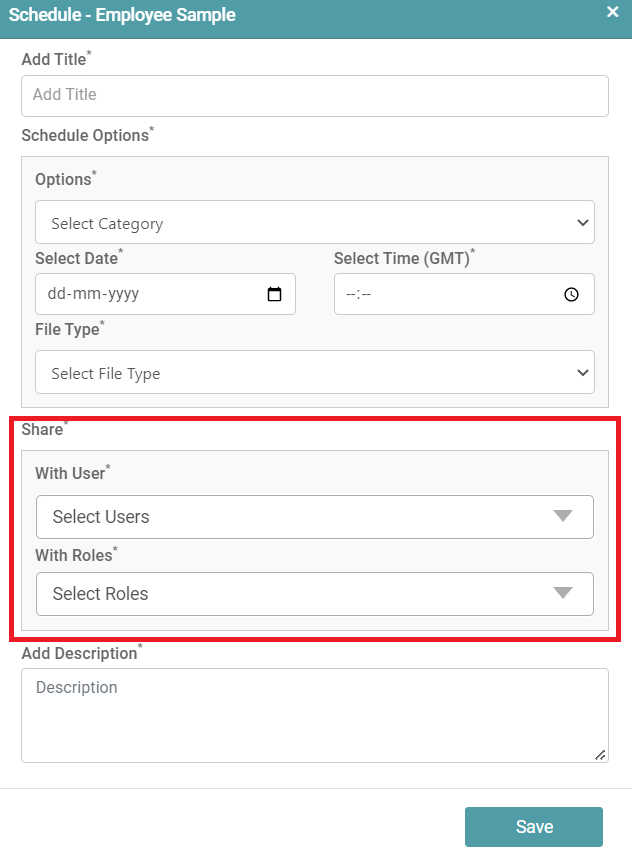
Step 6: Finally, a description for the chart can be added by the user based upon the chart generated. Click on the save button.
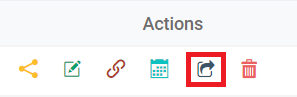
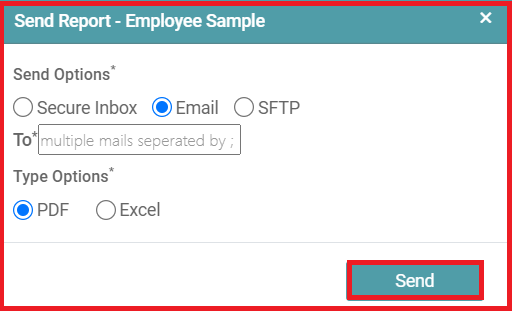
Send
Step 1: Click on the send button to send the chart to different users. (Refer to the image below).
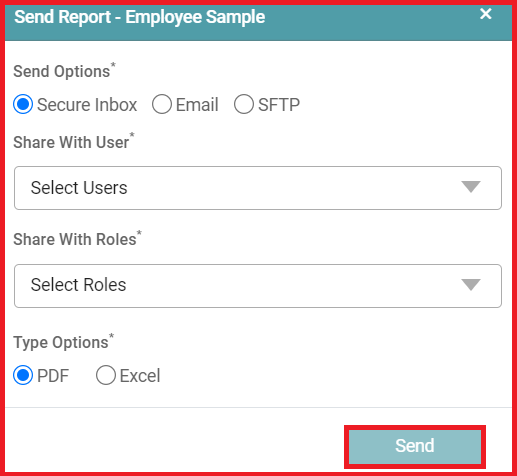
Step 2: A pop-up appears. To send the chart, the user can choose from the different options available. The user can choose ‘Secure Inbox/ Email/ SFTP radio buttons.
Secure Inbox
Step 1: In this, the user needs to select the users and the roles. Along with this the user needs to select the type in which the chart should be shared.
Step 2: After selecting all the options, click on “send” button. (Refer to the image below).
Step 1: In the email feature, the user can send the chart to multiple users by typing their email addresses which should be separated by a comma.
Step 2: Here, users also have the option to select the format in which the charts need to be sent and finally after all the selection, the user needs to click on the send button. (Refer to the image below).
SFTP
Step 1: SFTP is Secure File Transfer Protocol which is another way through which users can send files. (Refer to the image below).
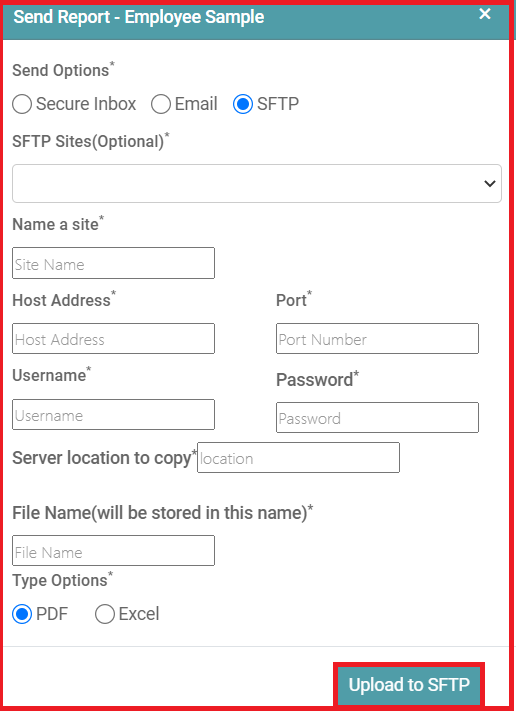
Step 2: Enter the SFTP Sites (Optional) then Enter Name of the Site, Host Address, Port number.
Step 3: Enter the Username & Password then enter Server location. Lastly, enter the File Name which you want to store.
Step 4: Select between PDF & Excel File Type. Click on ‘Upload to SFTP’.
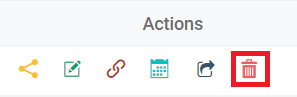
Delete
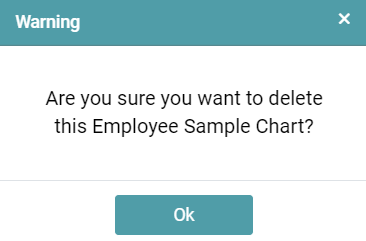
Step 1: Select this option to delete this chart. (Refer to the image below).
Step 2: A warning pop-up appears. Click on “OK” to confirm the file deletion. (Refer to the image below).
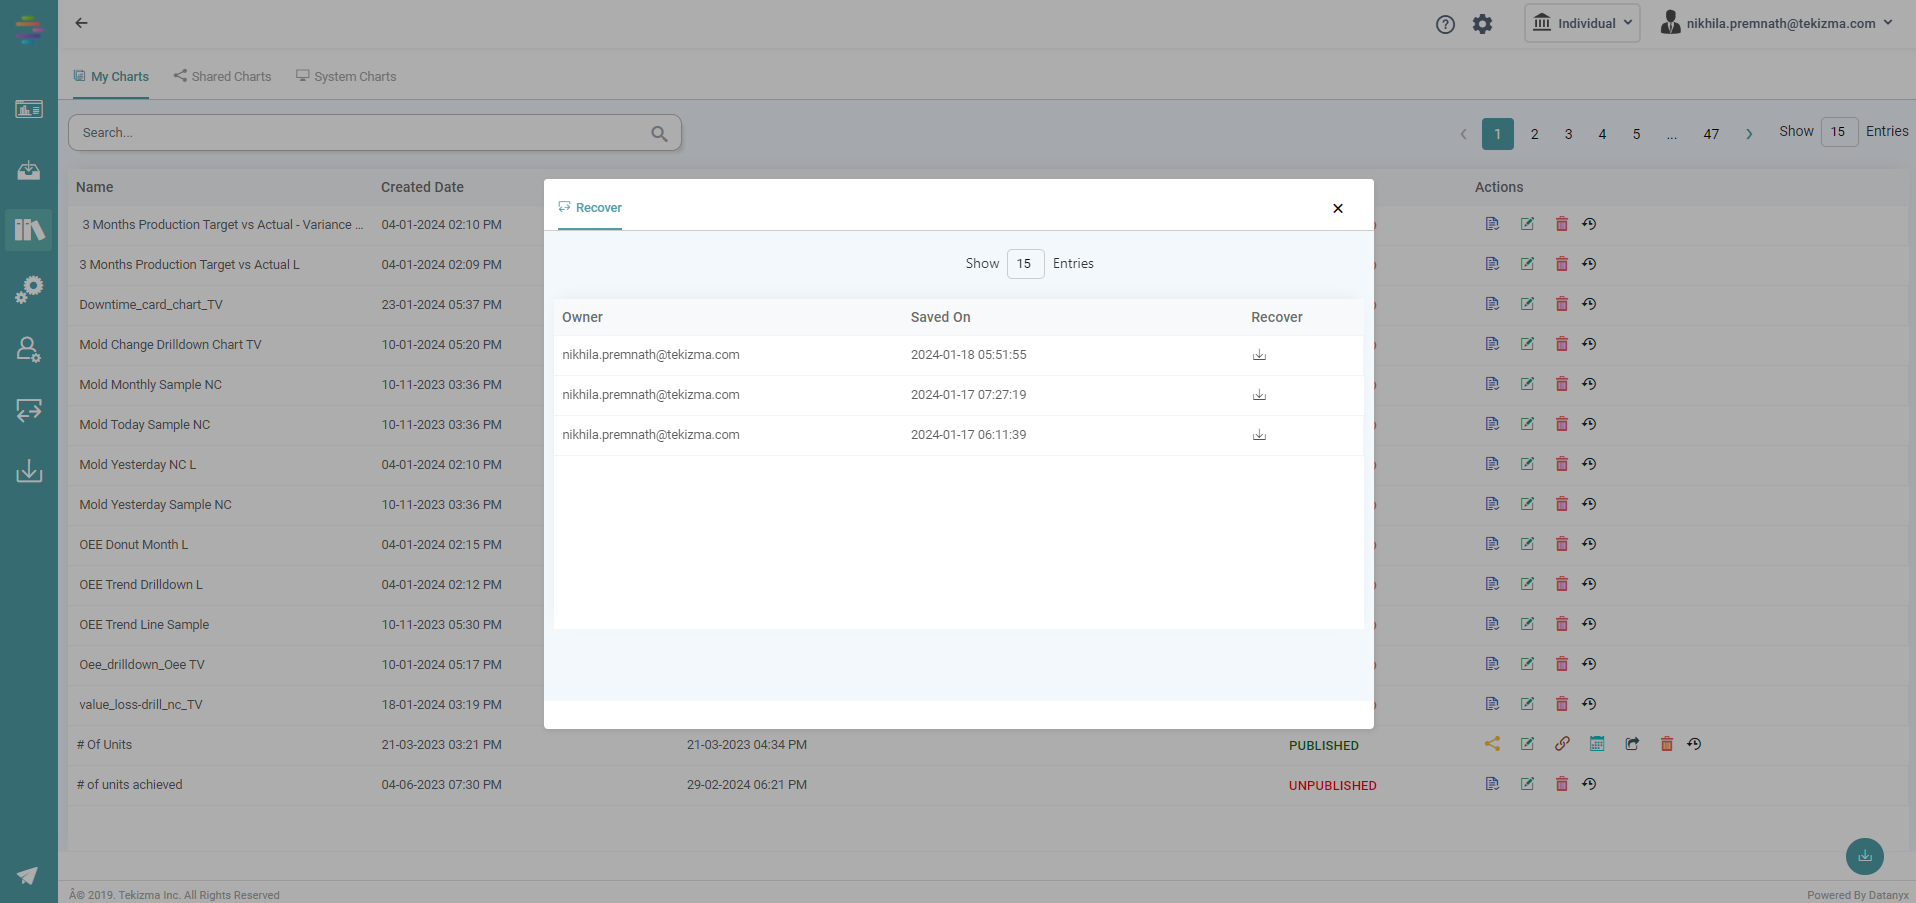
Recovery
The library allows access to the reports, charts and workflows created.
Step 1: On the main navigation bar, click on Library.
Step 2: The user can recover Reports/ Charts based on the date and time the respective reports and charts have been created.
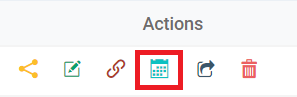
Step 3: Click on the recovery icon under actions to recover the saved Reports/ Charts. (Refer to the image below).
Step 4: The user will be able to see the entries of the Report/ Chart and will be able to see the date and time it has been saved on.
Step 5: Now, the user can recover and override the existing Report/ Chart with any of the logs in the list. (Refer to the image below).
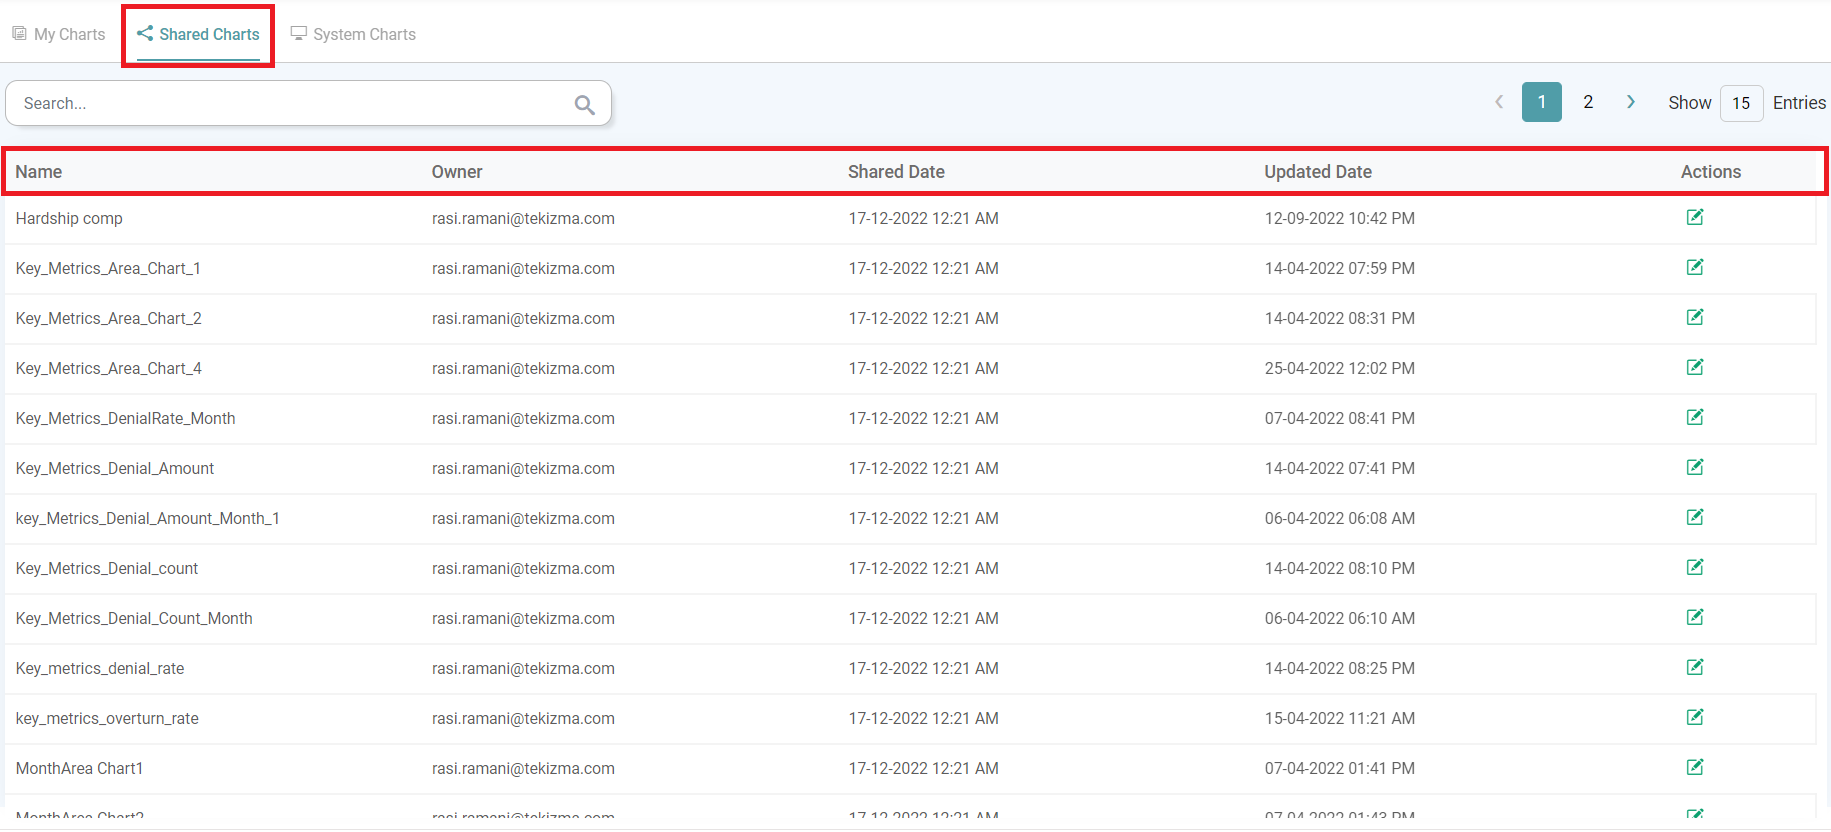
Shared Charts
Under shared charts, you can access the list of all the charts that have been shared with you. It includes:
- Name
- Owner
- Share Date
- Updated Date
- Actions
(Refer to the image below).
System Charts
Under system charts, you can access the list of System Charts.
System charts include –
- Name
- Created Date
- Updated Date
- Actions