My Reports
The Various tags included in My Reports section are:
- Name
- Default in Dashboard
- Show in Dashboard
- Order in Dashboard
- Created Date
- Updated Date
- Status and Actions
Actions under My Reports and Shared Reports are the same
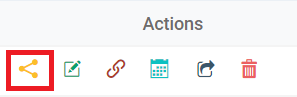
Share
The share button helps in sharing the report to different users based upon the roles. (Refer to the image below).
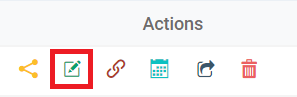
Edit
The edit button helps in making changes in the existing reports created. (Refer to the image below).
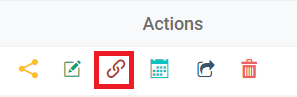
Embed Link
The embed link creates the URL link for the report that has been generated. Click on the “embed” link icon under actions. A pop-up screen appears. (Refer to the images below).
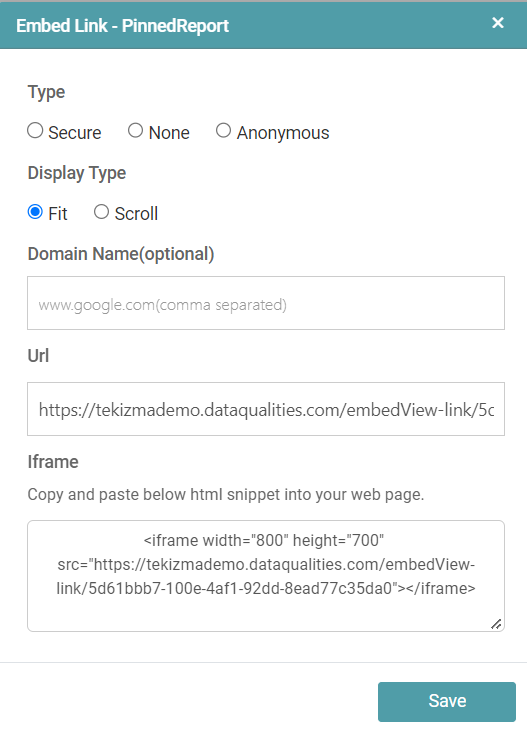


The options available to the users are as follows:
- Type
- Display type
- Domain name (which is optional)
- URL
- iframe
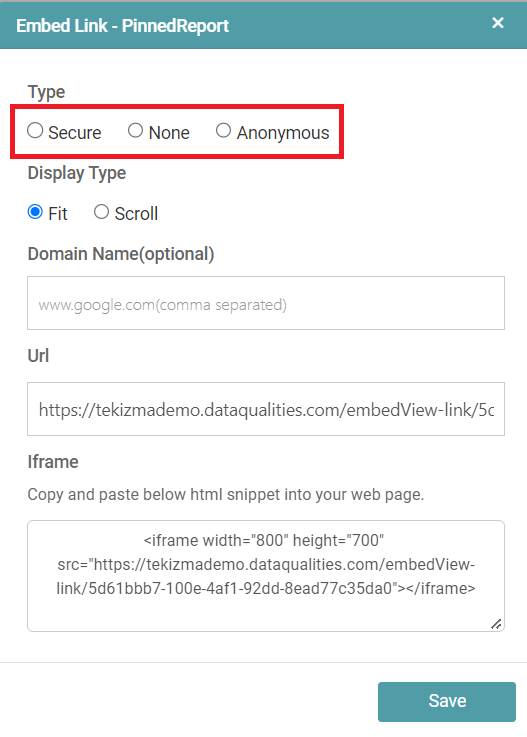
Type
Under type, the users can choose between the following radio buttons:
Secure
The user is able to protect the URL and the said URL cannot be viewed anonymously.
None
The user can share this with anyone, and no username or password is required to open such reports.
Anonymous
The user is able to share this type of report with anyone. There is no requirement of username or password to open such reports. (Refer to the image below).
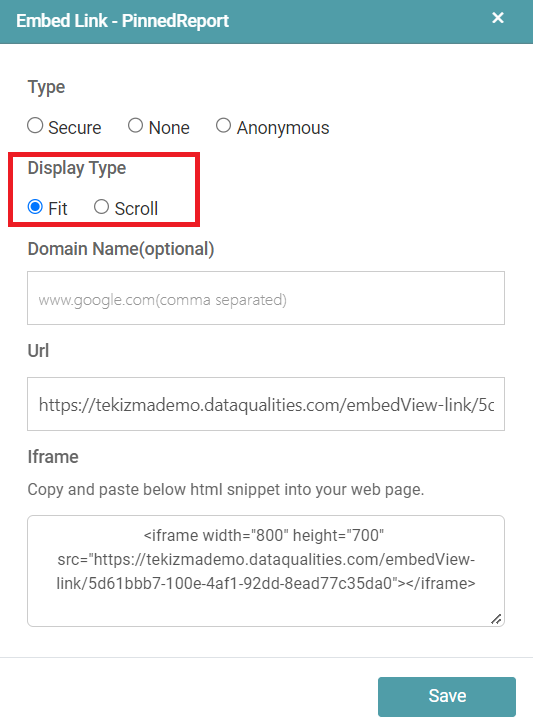
Display Type
Under display type, the users can choose between “Fit” or “Scroll”.
Fit
When the user chooses this option, the contents are generated in a single page.
Scroll
The scroll option generates the report such that the user has to scroll down to view the contents of the report. (Refer to the image below).
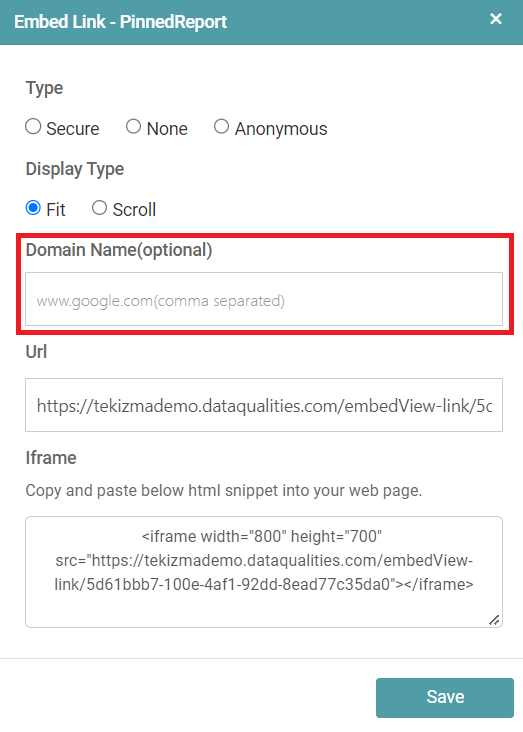
Domain Name
The user can select the domain name. The selection of the same is optional. (Refer to the image below).
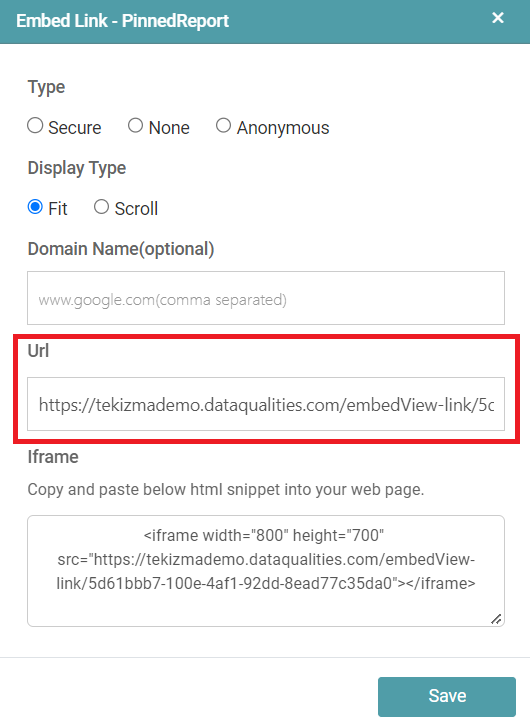
URL
Step 1: A URL will be available to the user under the URL option.
Step 2: The users can Share/ Copy/ Paste the URL in a new window.
Step 3: The person with the URL is able to generate and view the report. “None” and “Anonymous” types does not require login credentials to view the report. (Refer to the image below).
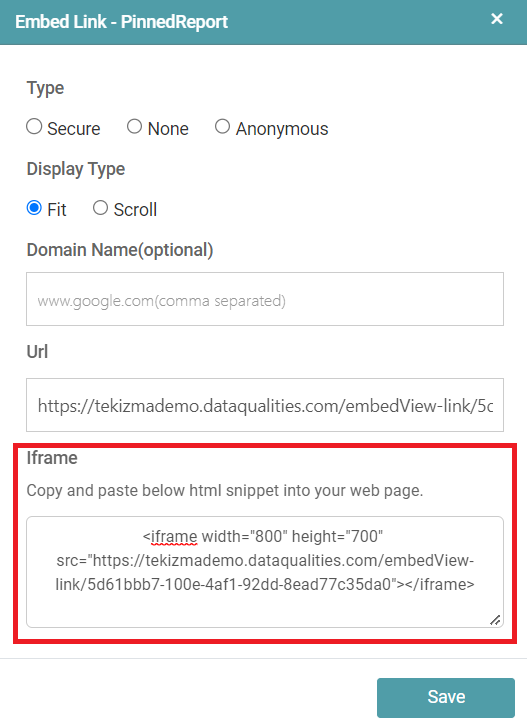
Iframe
Lastly, iframe is the HTML code for the report. If the user copies the link and pastes it in the design report HTML tab, the report will be visible. (Refer to the image below).
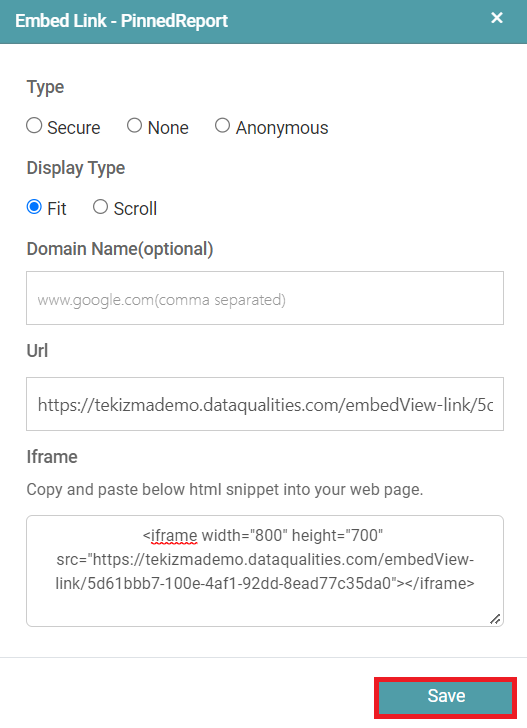
Finally, the user can click on the “save” button. The options that were previously selected by the user will also be saved. (Refer to the image below).
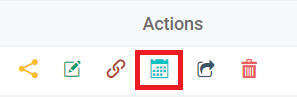
Schedule
Step 1: The schedule button aids in the sharing of the report based upon the schedule fixed.
Step 2: A ‘Schedule’ pop-up appears once the user clicks on the schedule icon. (Refer to the images below).
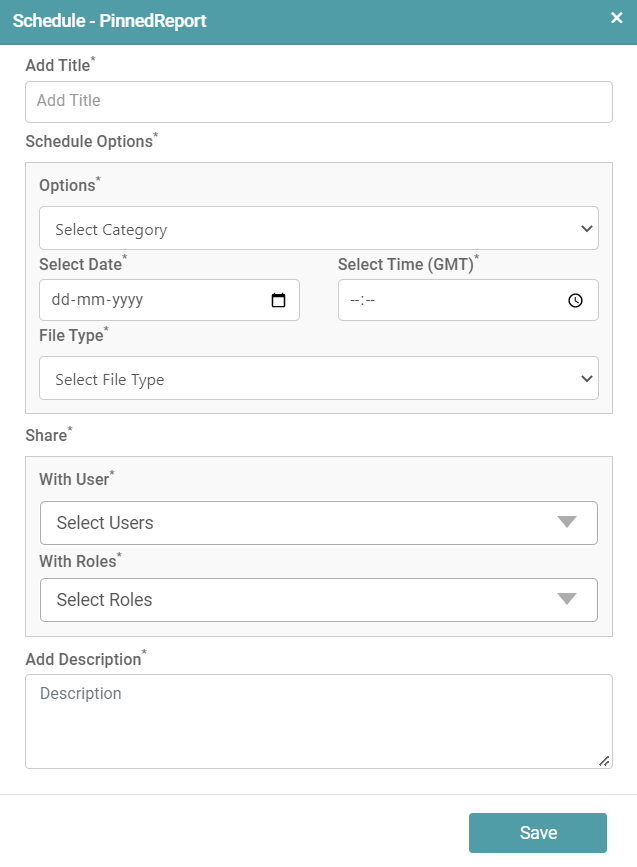
Step 3: The report created by the user can be scheduled for display for different users.
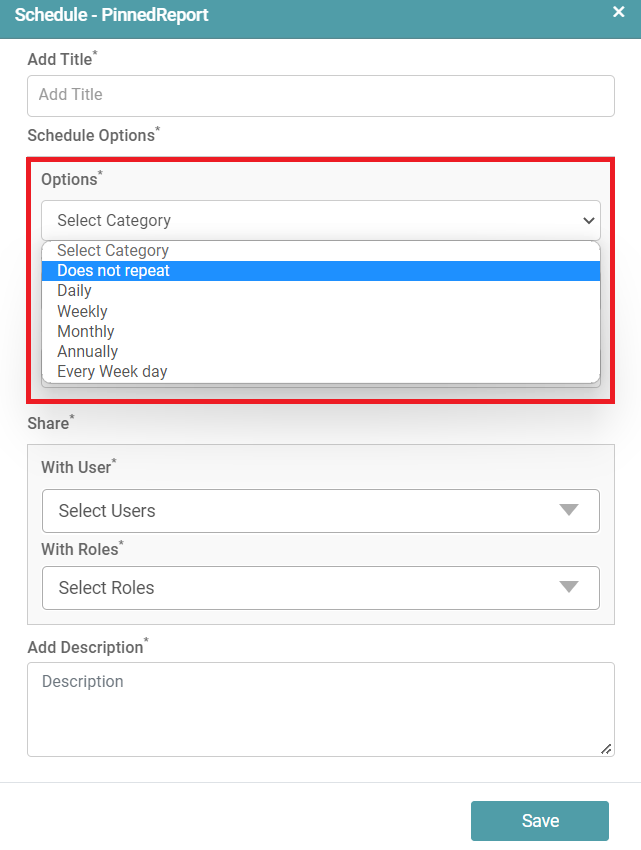
Step 4: Now, the user is able to add title and schedule options. The user needs to select category of display i.e., how the schedule is categorized. (Refer to the image below).
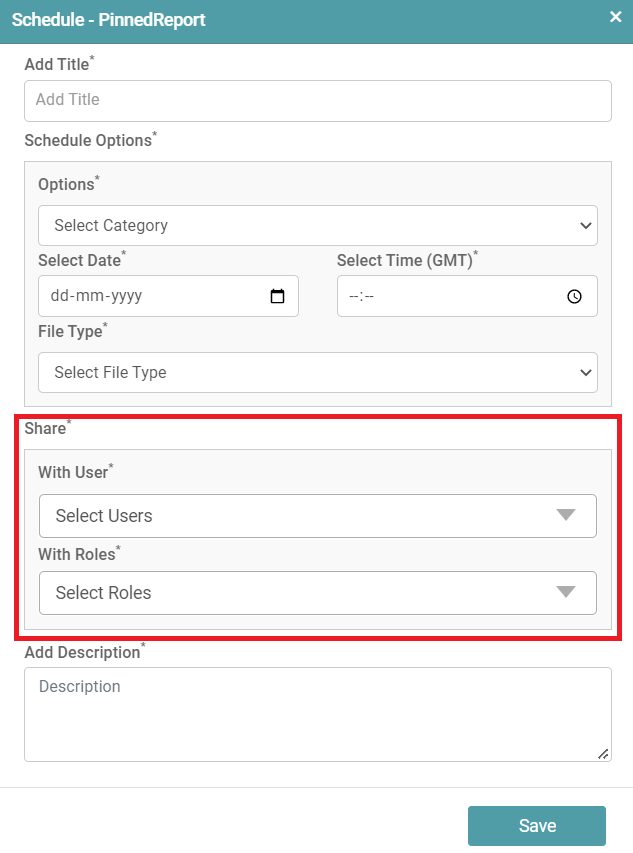
Step 5: Post this, the user has an option of scheduling the display of the report with the users he wants to share it with. He can also choose the individual roles of the user. (Refer to the image below).
Step 6: Finally, a description for the report can be added by the user based upon the report generated. Click on the save button.
Send
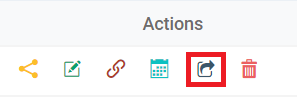
Step 1: Click on the send button to send the report to different users. (Refer to the image below).
Step 2: A pop-up appears. To send the report, the user can choose from the different options available. The user can choose ‘Secure Inbox/ Email/ SFTP radio buttons.
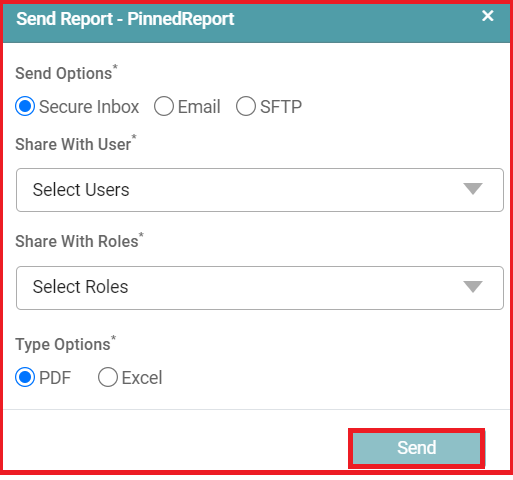
Secure Inbox
Step 1: In this, the user needs to select the users and the roles. Along with this the user needs to select the type in which the report should be shared.
Step 2: After selecting all the options, click on “send” button. (Refer to the image below).
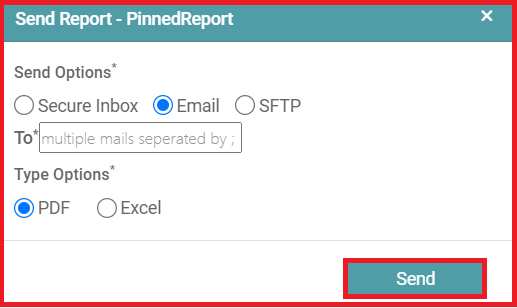
Step 1: In the email feature, the user can send the report to multiple users by typing their email addresses which should be separated by a comma.
Step 2: Here, users also have the option to select the format in which the reports need to be sent and finally after all the selection, the user needs to click on the send button. (Refer to the image below).
SFTP
Step 1: SFTP is Secure File Transfer Protocol which is another way through which users can send files. (Refer to the image below).
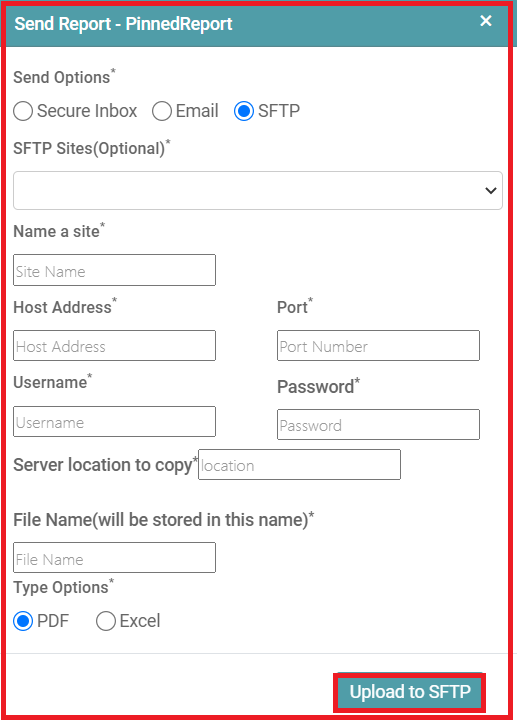
Step 2: Enter the SFTP Sites (Optional) then Enter Name of the Site, Host Address, Port number.
Step 3: Enter the Username & Password then enter Server location. Lastly, enter the File Name which you want to store.
Step 4: Select between PDF & Excel File Type. Click on ‘Upload to SFTP’.
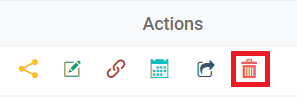
Delete
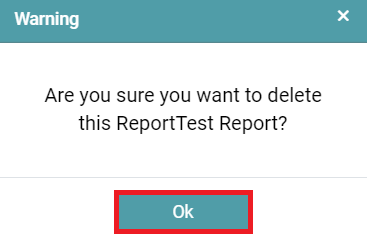
Step 1: Select this option to delete this report. (Refer to the image below).
Step 2: A warning pop-up appears. Click on “OK” to confirm the file deletion. (Refer to the image below).
Recovery
The library allows access to the reports, charts and workflows created.
Step 1: On the main navigation bar, click on Library.
Step 2: The user can recover Reports/ Charts based on the date and time the respective reports and charts have been created.
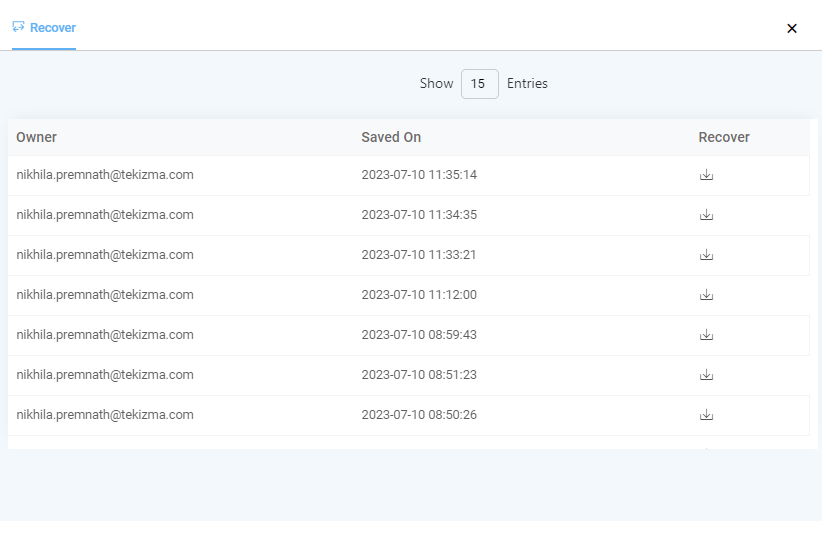
Step 3: Click on the recovery icon under actions to recover the saved Reports/ Charts. (Refer to the image below).

Step 5: The user will be able to see the entries of the Report/ Chart and will be able to see the date and time it has been saved on.
Step 6: Now, the user can recover and override the existing Report/ Chart with any of the logs in the list. (Refer to the image below).
Import
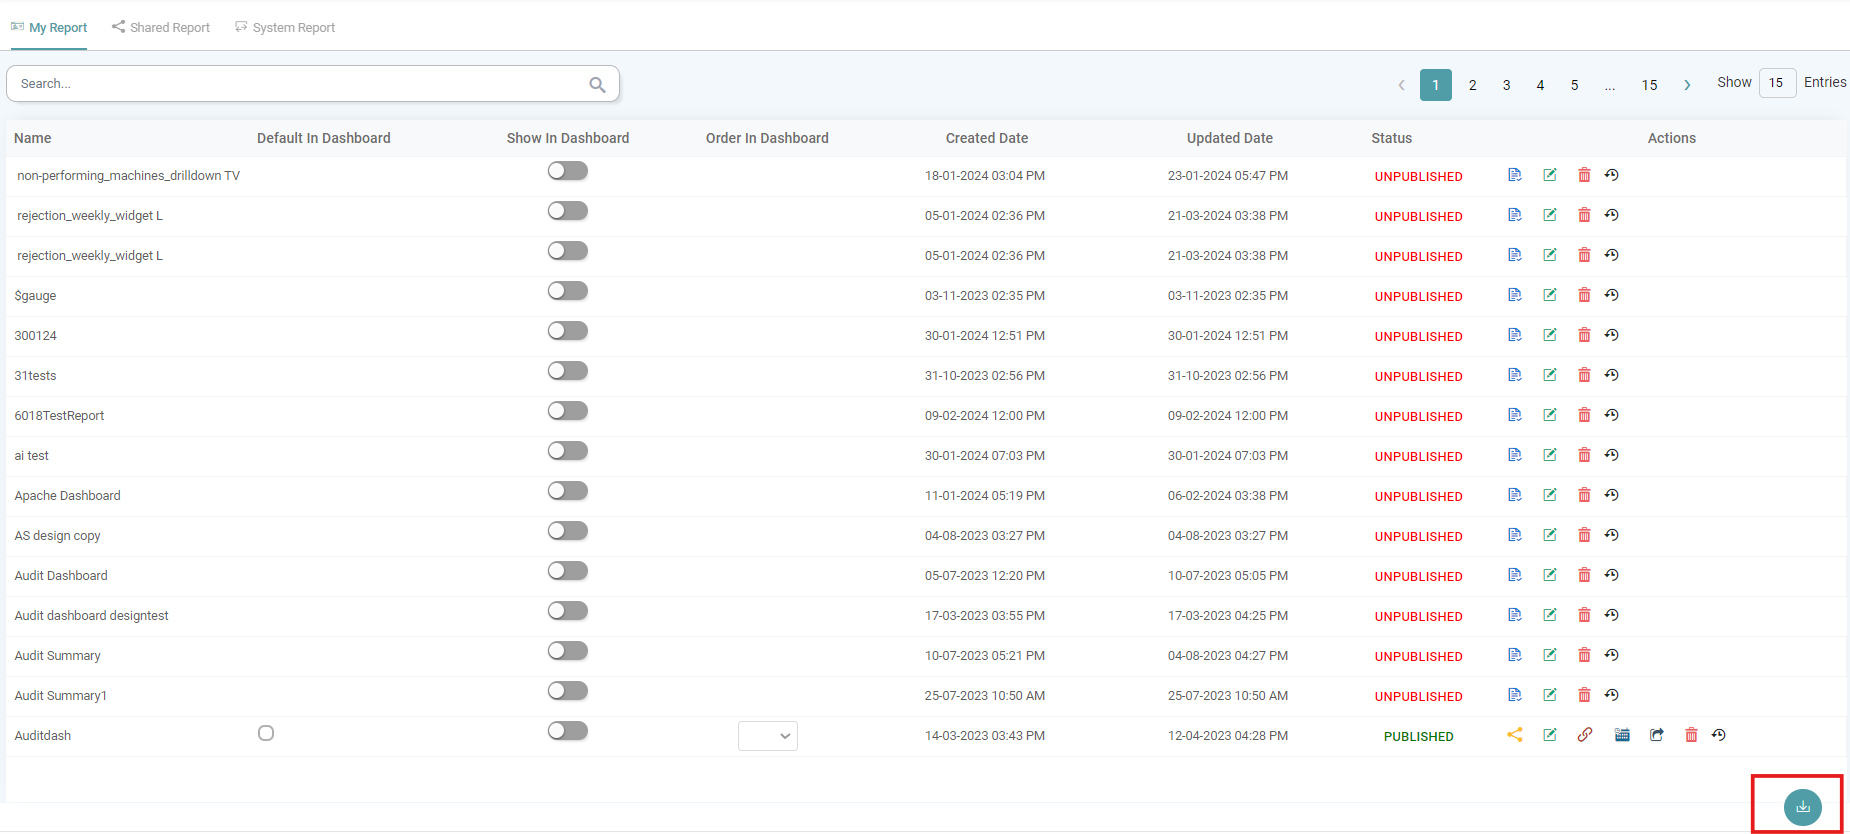
Step 1: On the main navigation bar, click on Library and Reports.
Step 2: Under the My Report tab, click on the Import button located at the bottom right. (Refer to the image below).
Step 3: The Import Report poop-up appears. (Refer to the image below).
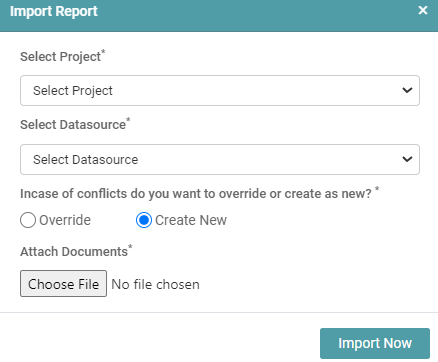
Step 4: You need to Select the following:
- Select Project: The Project/ Folder under which you want the Report to be stored.
- Select Datasource: The Datasource which was used for the Report creation.
- Override: If there is a Existing Report, you can choose to Override it with the new RPT.
- Create New: If you do not wish to Override the Report, you can Create a New Report.
- Attach Documents: The RPT that had been Exported from the Report Designer Page needs to be imported here.
Step 5: Click on the Import Now button. Your report is now Imported, Click ok.
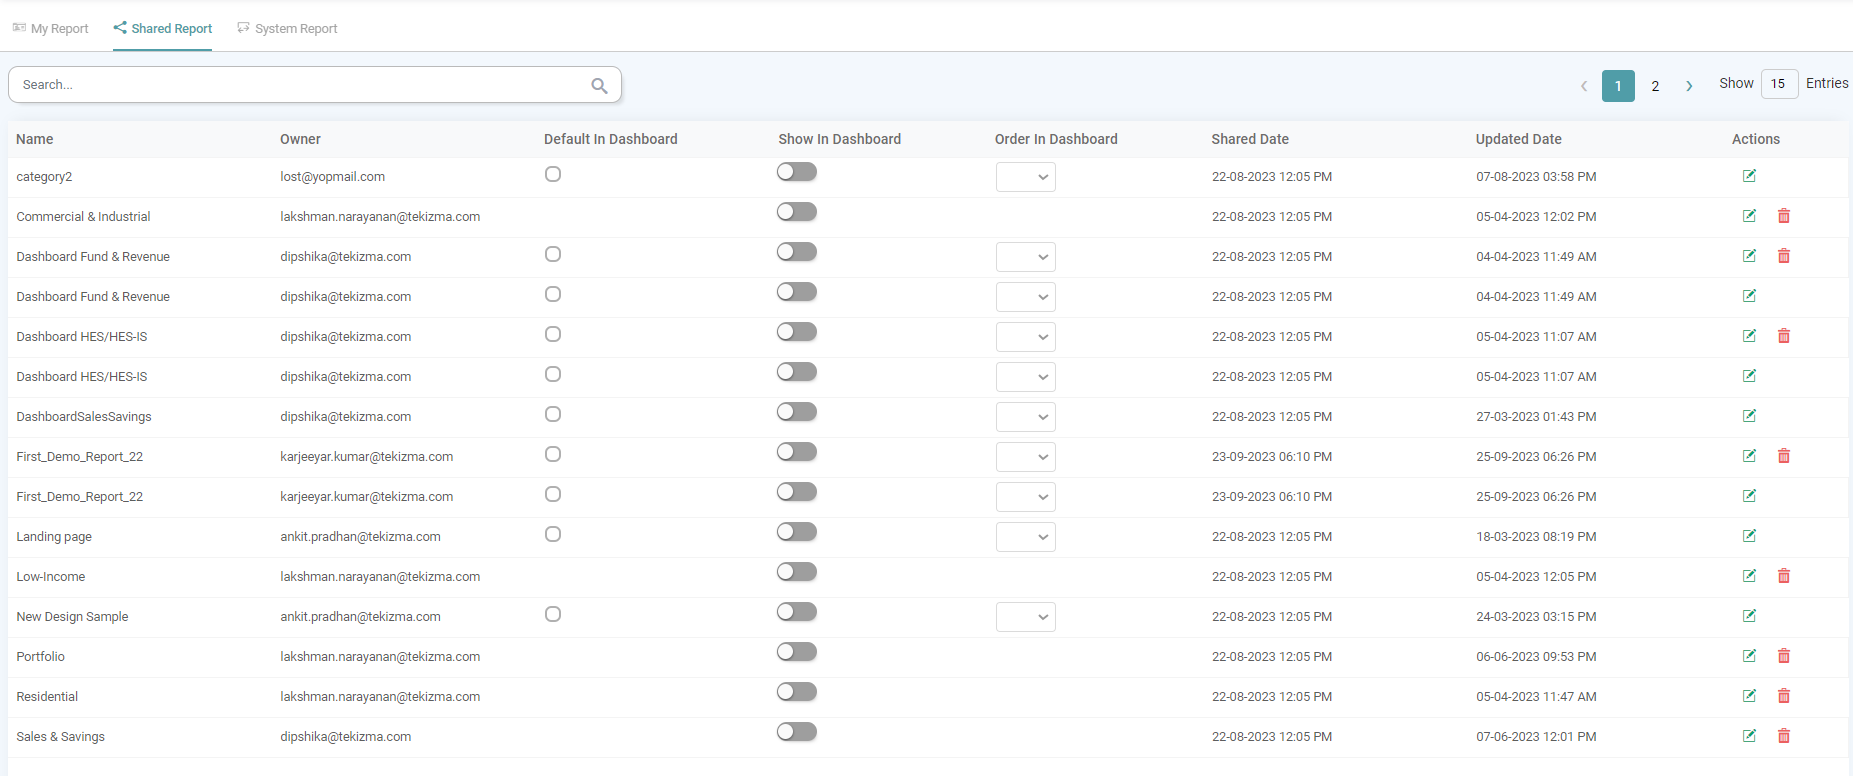
Shared Reports
Within the Shared reports tab, the users can access the list of all the reports that have been shared with them.
The Various tags included in Shared Report section are:
- Name: The name of the Report Shared.
- Owner: The Email ID of the user who has shared the said report with you is listed here.
- Default in Dashboard: Setting a report as the default in your dashboard makes it the first report to load when you open the dashboard.
- Show in Dashboard: The Show in Dashboard Toggle when toggled off will not display the respective report on the Dashboard Page. Toggle it on to display the Report on the Dashboard Page.
- Order in Dashboard: You can select an Order for the Reports to get displayed on the Dashboard Page by assigning it a number from 1 to 200+.
- Shared Date: The Date & Time on which the Report was shared is listed here.
- Updated Date: The last Updated Date & Time of the Report is listed here.
- Actions: The Edit and Delete options are listed under this tag.
(Refer to the image below).
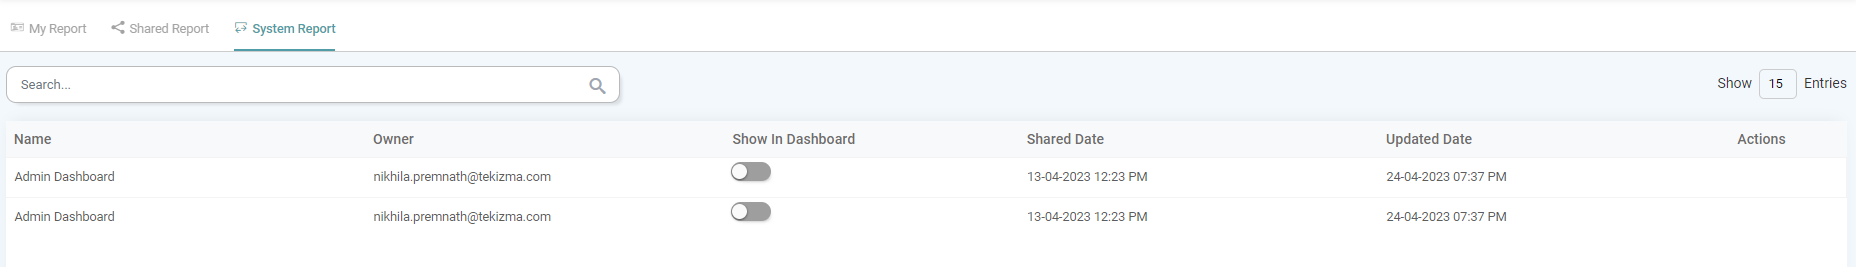
System Report
Within the System reports tab, the users can access the list of all the reports that are System Reports (Create System Reports).
Note: The Other Options under the System Reports Tab are similar to that of My Report and Shared Report. (Refer to the image below).
Custom Report
The Custom Report feature allows users to create personalized versions of existing base reports. This enables users to apply specific filters and column preferences and save them as separate reports for quick access later.
Additionally, users can schedule their custom reports to run automatically at defined intervals, ensuring timely access to updated data.
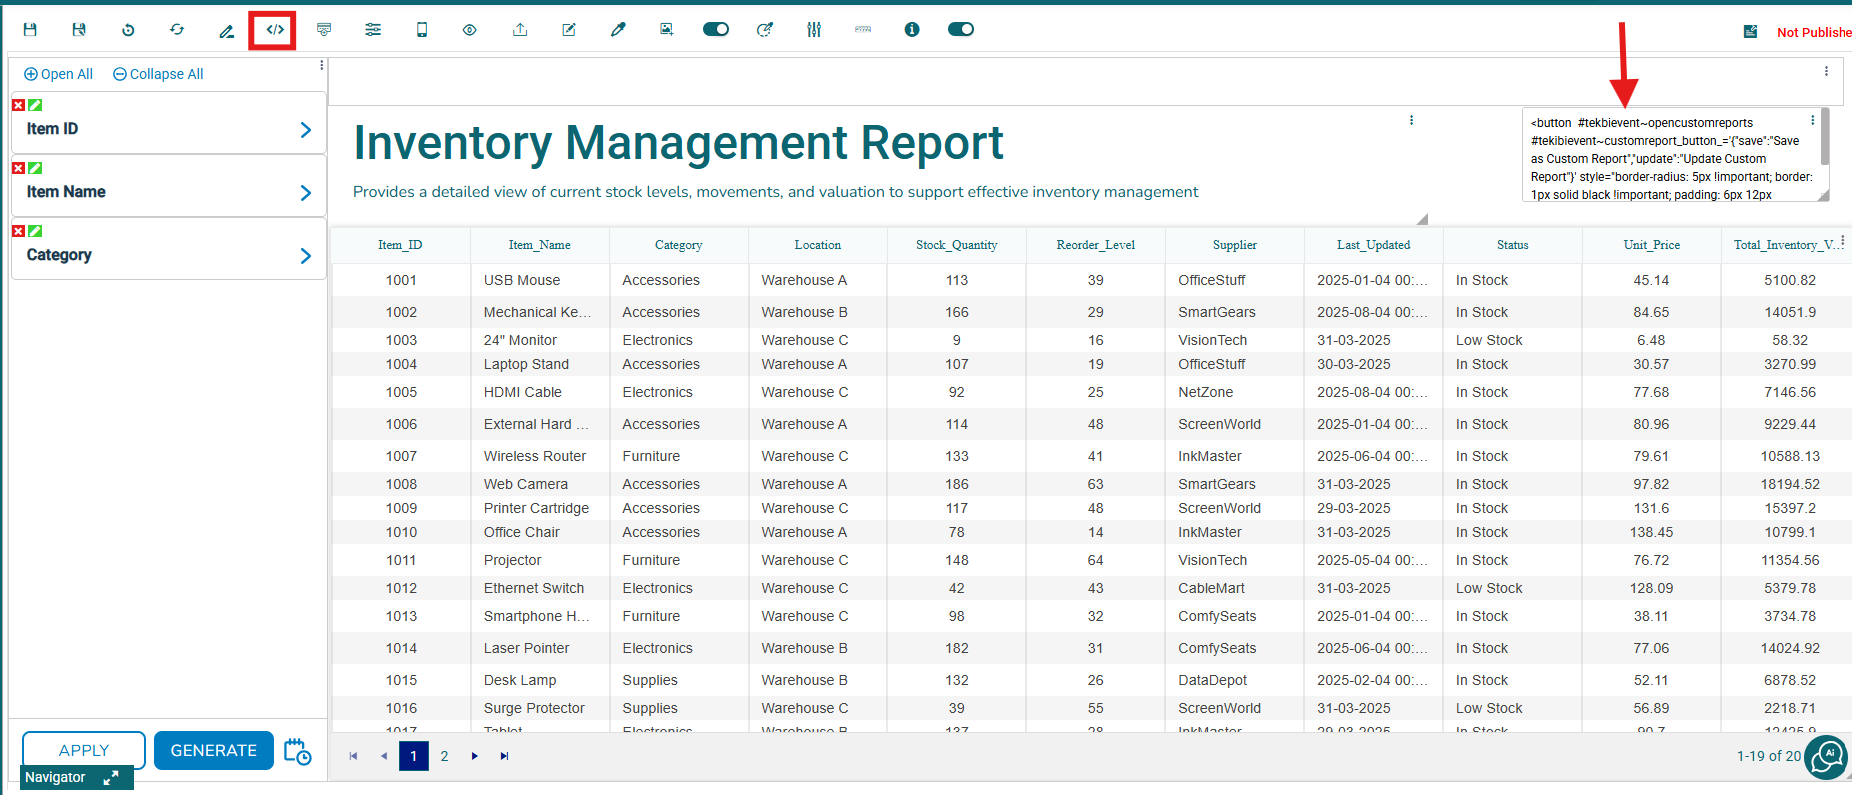
Creation of Custom Report
Step 1: Open the desired base report in the Report Designer page.
Step 2: On the top toolbar, click Custom HTML and paste the following HTML code into the editor:
<button #tekbievent~opencustomreports #tekibievent~customreport_button_='{“save”:”Save as Custom Report”,”update”:”Update Custom Report”}’style=”border-radius: 5px !important; border: 1px solid black !important; padding: 6px 12px !important; cursor: pointer !important;”> Save as Custom Report </button>
This button can be styled further as per the user’s preference. (Refer to the images below).
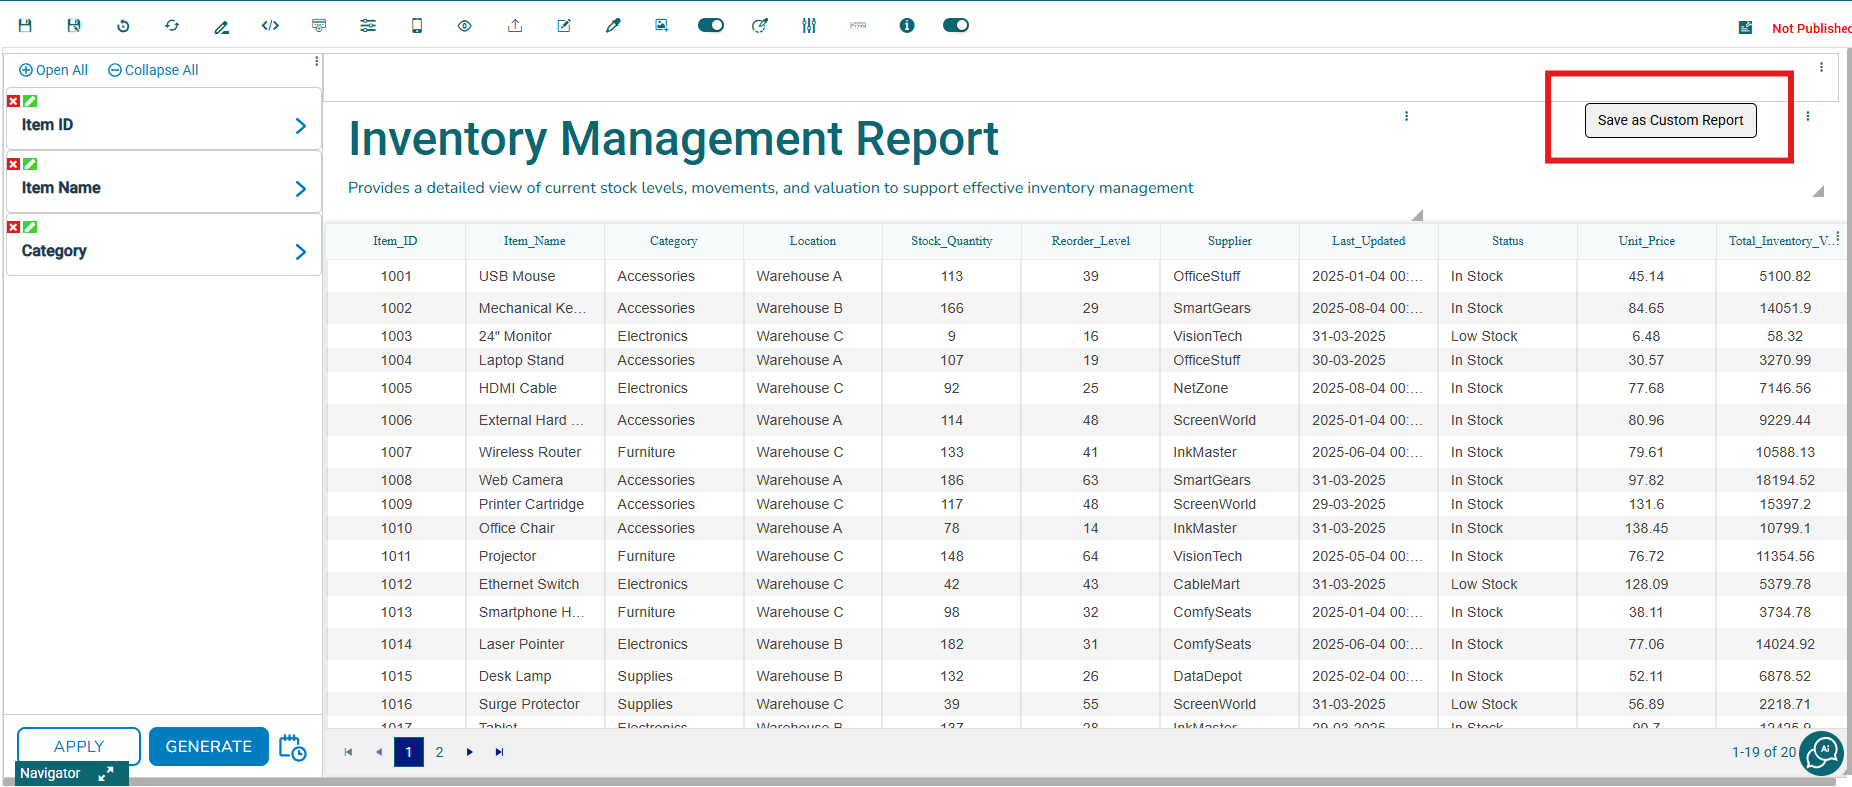
Step 3: After adding the button, save the report.
Step 4: Go to the Dashboard and open the corresponding base report. Apply the desired filters and column preferences, then click the Save as Custom Report button to create your custom report.
Step 5: Navigate to Library → Reports → Custom Report tab to view the created custom reports.
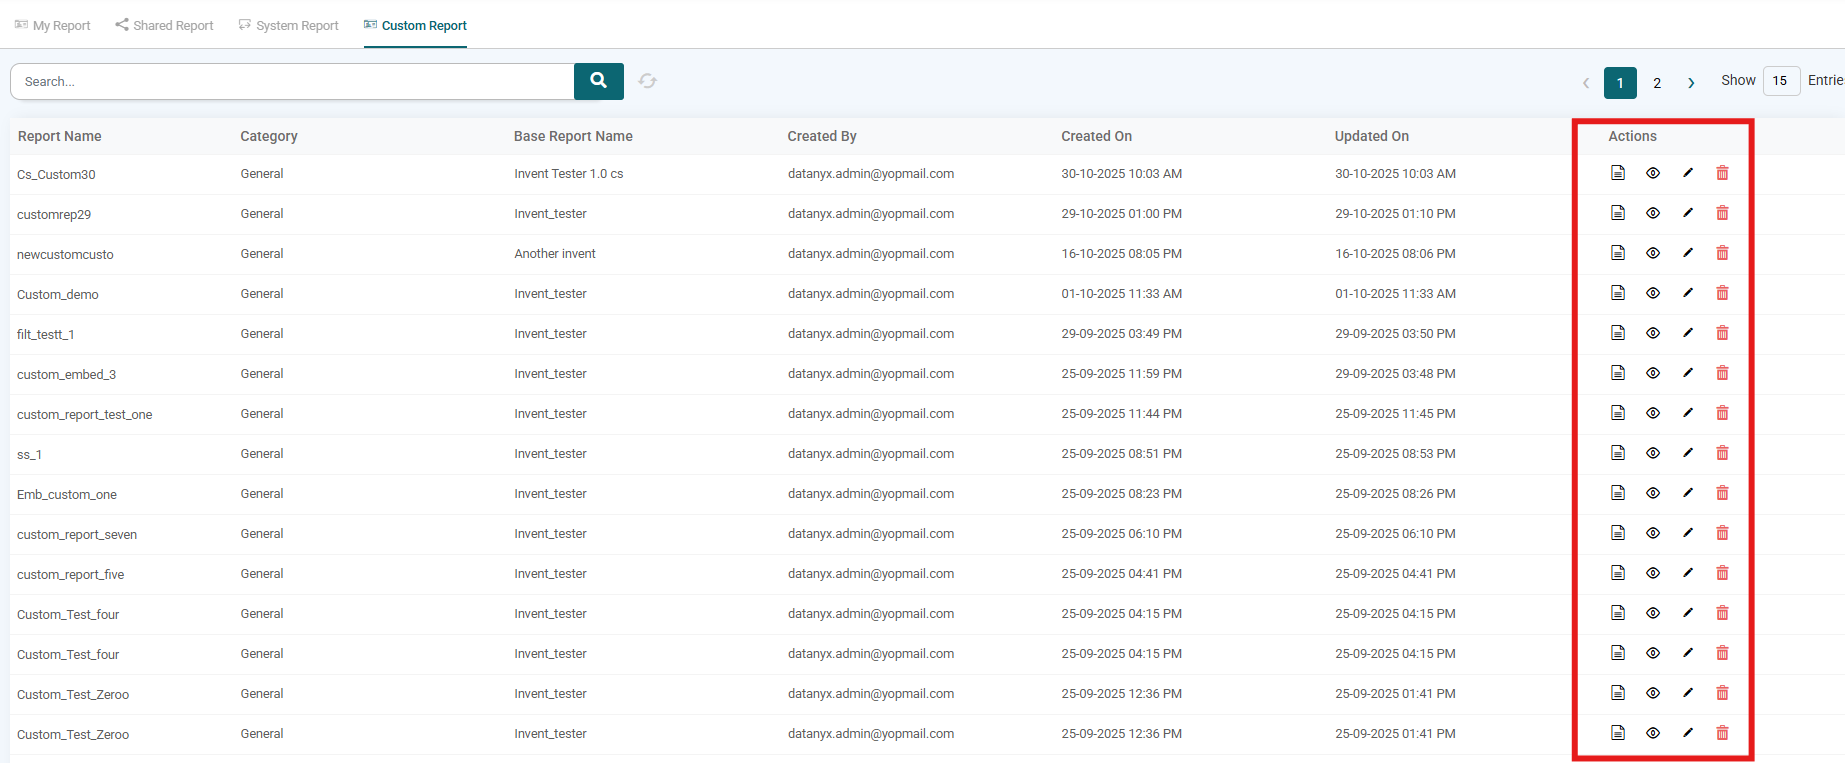
Managing Custom Reports
From the Custom Report tab, users can perform the following actions:
- Details: View the filters and column preferences applied to the report.
- View: Open and view the filtered report.
- Rename: Rename the custom report.
- Delete: Permanently remove the custom report.
Refer to the image below.
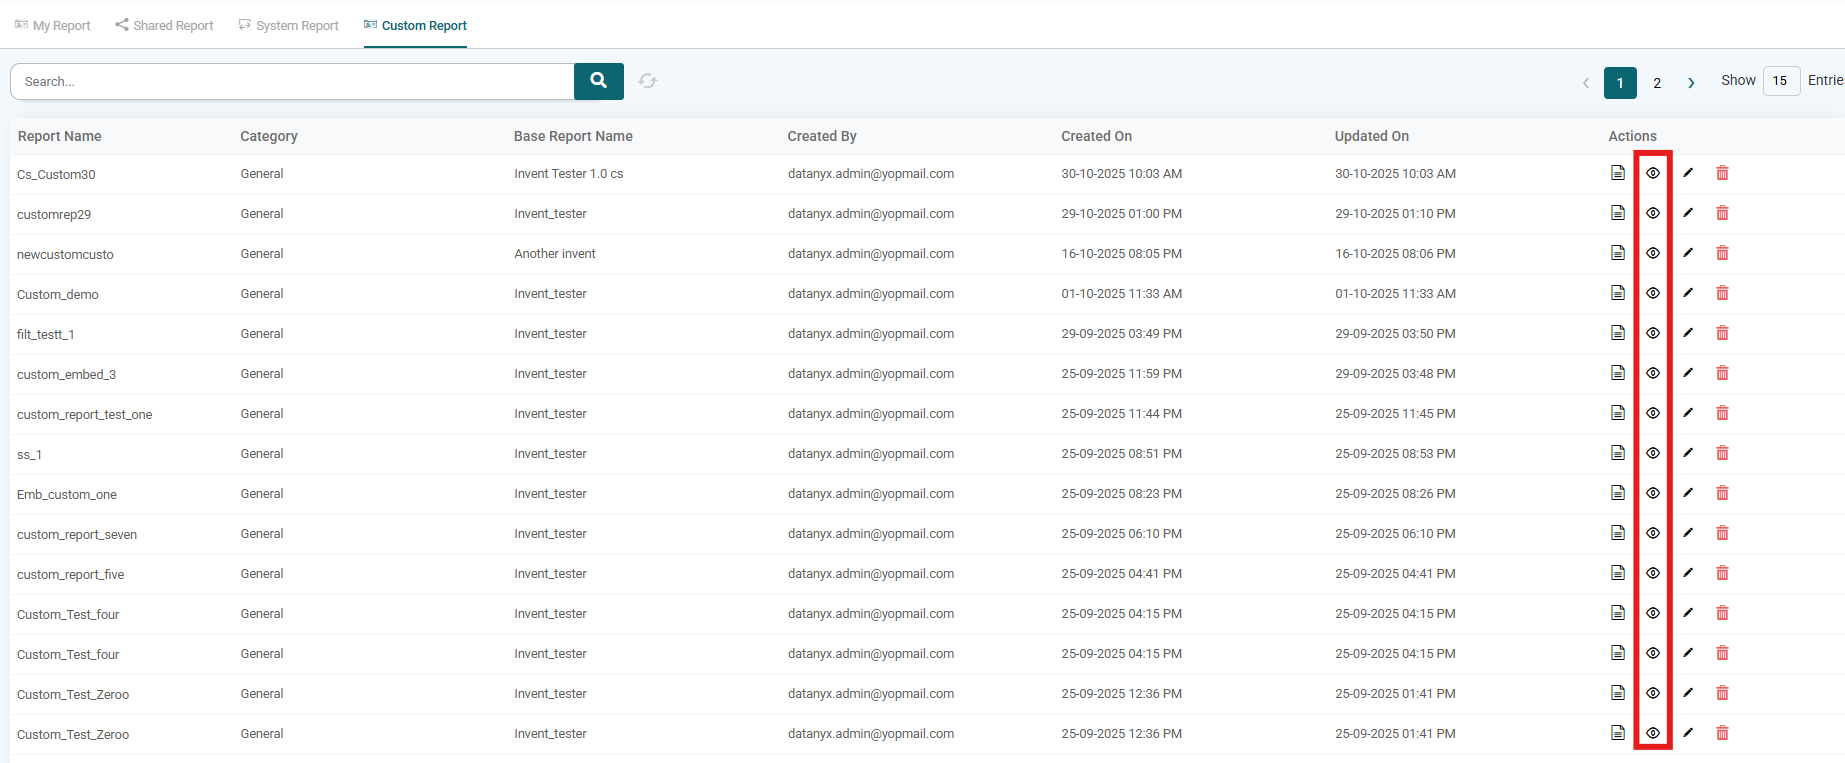
Updating a Custom Report
Step 1: Go to Library → Reports → Custom Report and click the View icon under Actions. (Refer to the image below).
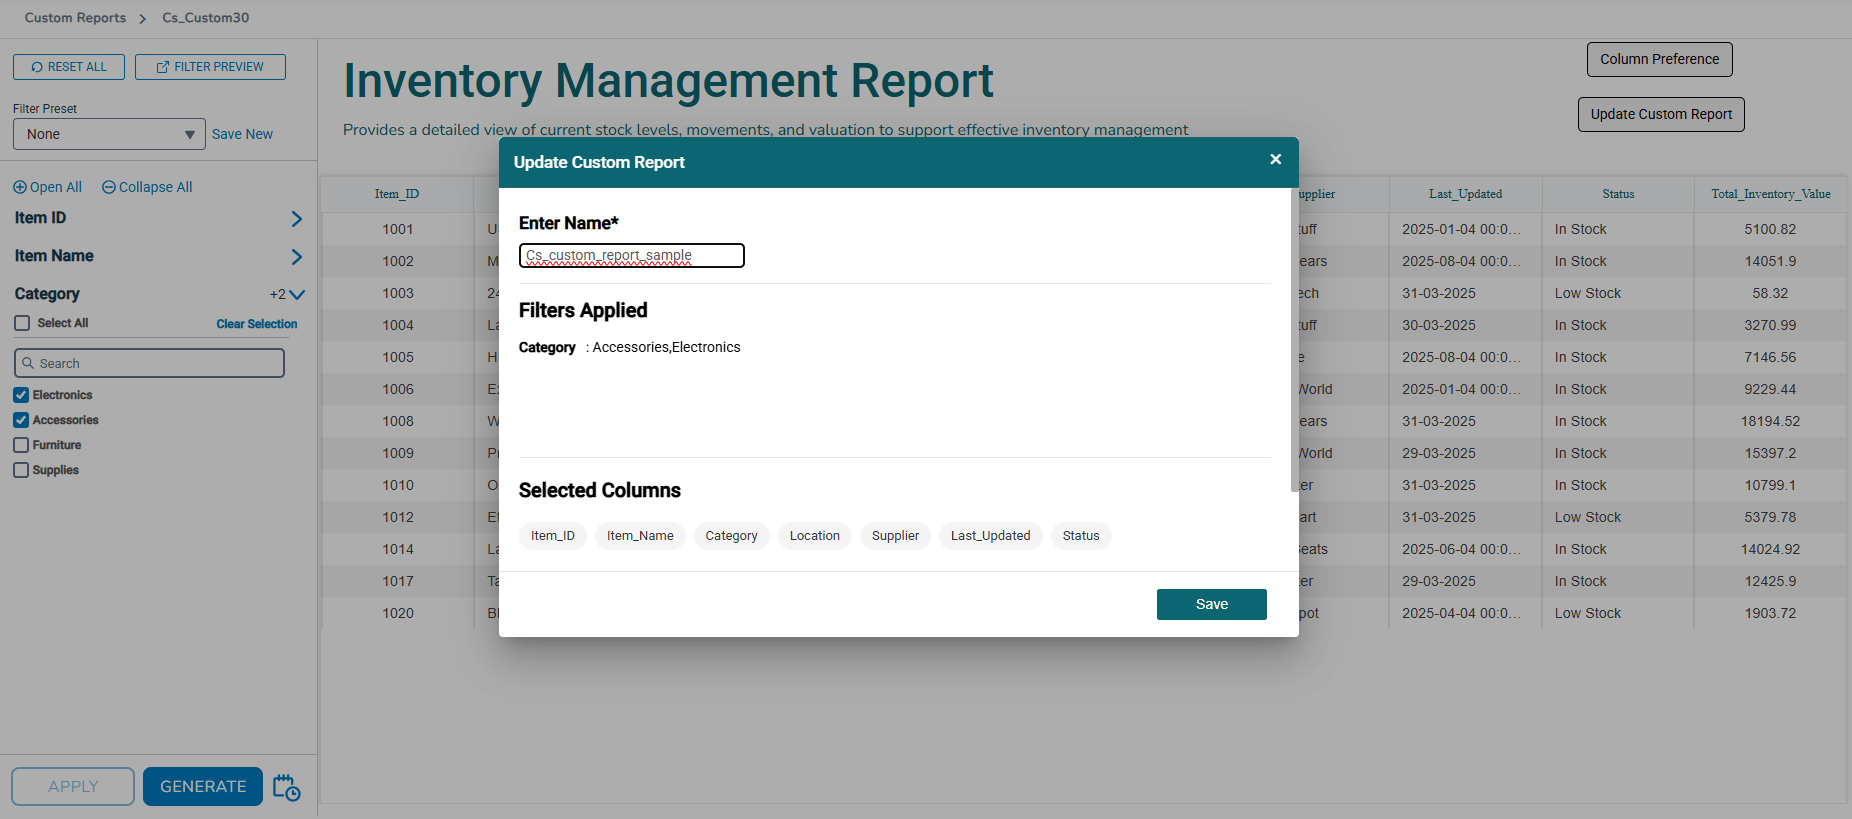
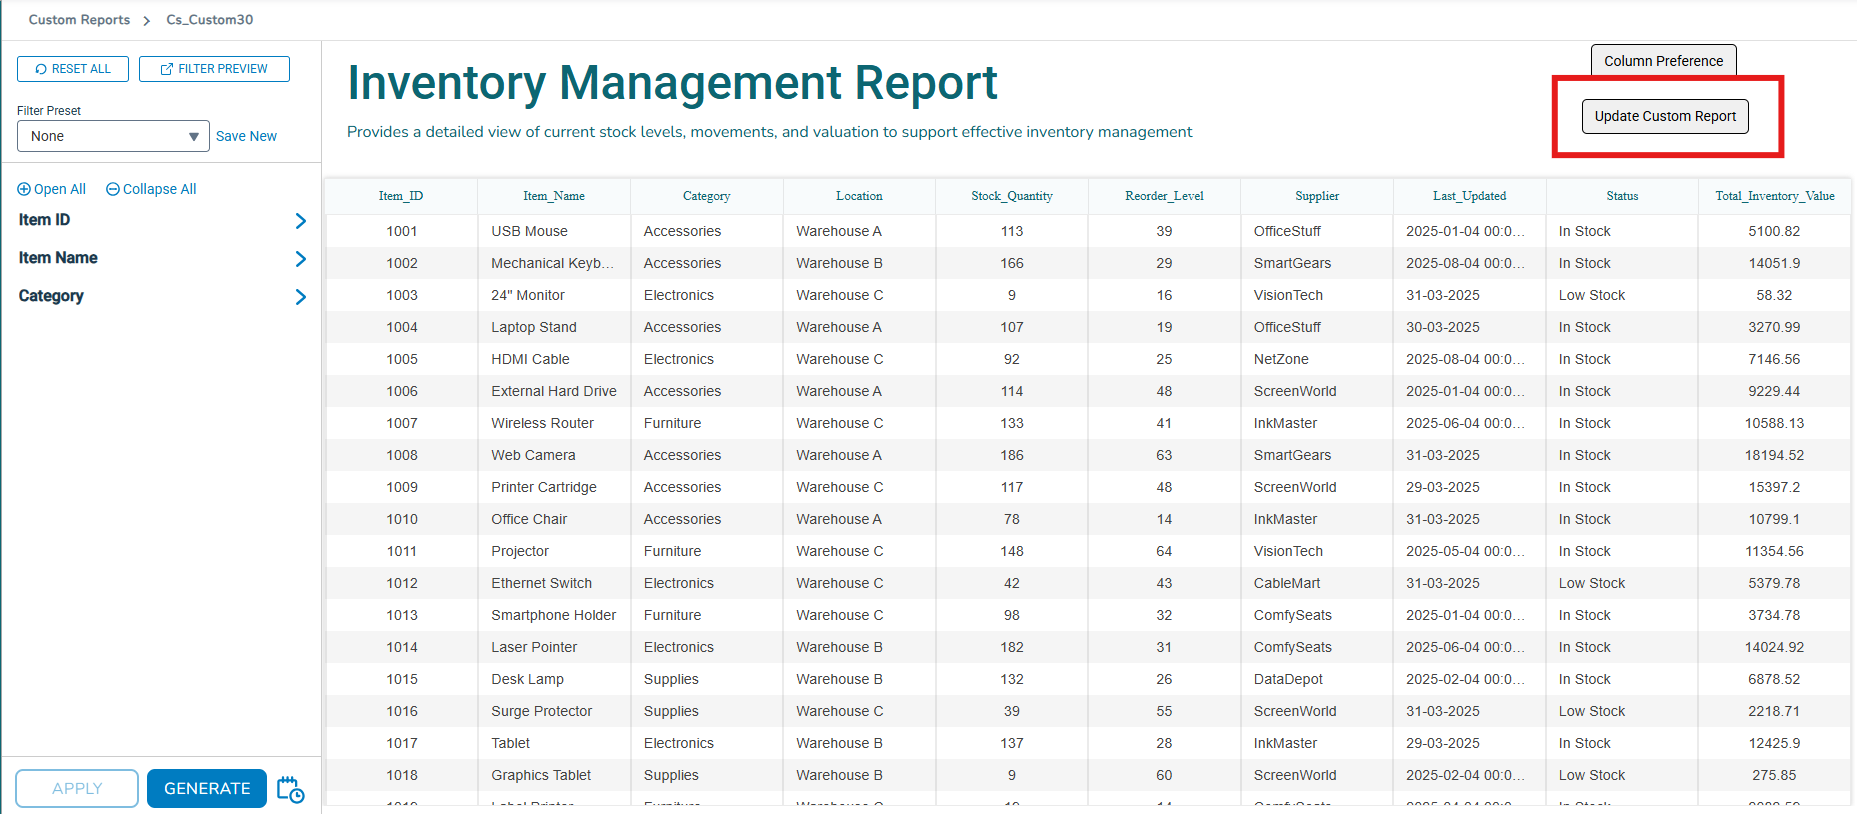
Step 2: Once the custom report opens, the Save as Custom Report button will now appear as Update Custom Report. Adjust the filters or column preferences as needed. (Refer to the image below).
Step 3: Click Update Custom Report. In the update pop-up, you can also rename the report by editing the name in the input field before saving. (Refer to the image below).