Datanyx is an easy-to-use business intelligence tool that helps in discovering information from raw data. It comes with a new state-of-the-art Report Designer that helps create eye catching visualization with modern charts. It is an easy-to- use and powerful BI analytical tool which mainly captures and processes data across all applications.
Supported Browsers
- Google Chrome
- Firefox
- Safari
- Microsoft Edge
Features of Datanyx
Datanyx comes with a lot of features and its usage as a business intelligence tool enables organizations to take well-informed management decisions and exercise proper control over various departments across different locations. The key features of Datanyx are listed as under:
- Self-service tool
- Real time dashboards
- Built using the latest technology
- Security tagging
- Secure Inbox
- Multi-level drill downs
- Multiple dashboards for custom view
- Integration with Python and R for advanced analytics
- Role-based access and privileges
- Multi-level drill downs
- Appealing data visualization with custom view
- Data cubes
- In-built dimensions of time and location
Why Datanyx?
- End to End support for Configuration and Integration.
- Roadmap as per client needs with quick turnaround.
- Cost Effective.
- SAAS and On-Premise.
- Built using the latest technologies.
- SOA architecture.
- Real-time dashboards with easy drag and drop action.
- Built with the latest technology: API integration.
Role-based User Access
- Datanyx offers Role-based user access and security features.
- Each user based on his role can view the data.
- For each role the KPI’s can be set.
- Each user can look at their respective dashboards.
- The pain areas can be easily identified.
Overview
Datanyx is a powerful business intelligence software which provides a very powerful BI analysis tool which mainly captures and processes data across all applications. It is a self- service BI software, and you can have multiple dashboards with customized view.
Datanyx also provides very appealing data visualization which connects to multiple Data sources and can be integrated with external systems which support about 30+ charts. Datanyx also provides an in-built secure inbox feature along with a feature of security tags such as PII, PHI, FTI etc. which mainly focuses on selective viewing or masking of confidential data as per need.
Datanyx also provides customized data analytics which can be integrated with Python and R for advanced analytics.
Datanyx also provides multi-level drill downs and various filters for designing reports and creating dashboards. Role-based access or privileges can be enabled as required.
Workflow
Datanyx has a very simple workflow which is extremely user friendly and easy to learn. Business users have various Data sources which they can connect to create reports and generate dashboards.
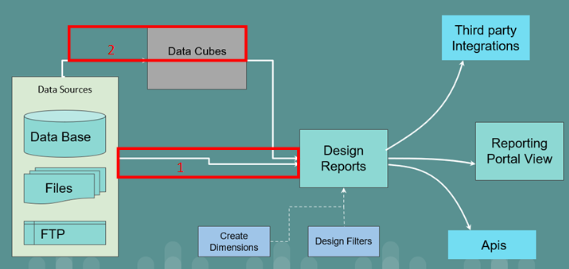


There are 2 ways of designing reports and creating dashboards:
- Firstly, an extremely simple way to straight-away connect the various Data sources and design reports and generate dashboards.
- You can also create Data Cubes and add dimensions and filters as a part of designing the report.
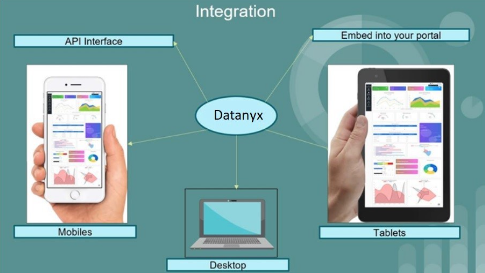
Integration
There are 3 ways to easily integrate the data. The reports created and dashboard generated can be easily integrated into:
- API interface
- Embedded into your own portal
- Third party integration. (Refer to the image below).